

What web analytics actually measures and why it matters for business growth
Key Website Metrics and What They Show
Web Analytics works by tracking and measuring how people use a website. It looks at web analytics metrics like page views, bounce rate, and traffic sources. Google Analytics 4 and tools like Matomo or Adobe Analytics offer detailed website analytics for businesses.
They show how many users visit the site and where they come from using website traffic analysis. Engagement metrics like session time and event tracking help businesses see if users find what they need.
User segmentation lets businesses see how different groups use the site. For example, behavior analytics and customer journey analytics show if new visitors act differently from returning ones.
These insights help spot trends by using enhanced measurement and event tracking. Companies use key events and funnel analysis to see how many people complete goals like signing up or buying.
Why Measuring Matters for Business Growth
Web analytics for business growth gives companies the data they need to improve. With conversion tracking and conversion rate optimization, businesses can test new ideas and measure results. Data-driven attribution and attribution modeling show which traffic sources or campaigns work best.
This helps companies spend money on what brings results. Server-side tagging, consent mode, and privacy-friendly analytics keep user data safe and follow rules.
Website performance metrics are also important. They help find problems like slow pages that can hurt user experience. Google Search Console checks how well a site appears in search results.
When businesses use digital analytics tools, they fix issues fast and keep users happy. Matomo, Adobe Analytics, and Google Analytics 4 help spot what works and what does not.
Turning Insights into Action
Website analytics does more than just show numbers. It helps businesses take action to grow. By using user behavior analytics, companies can improve site layout, add wanted features, or change content. They can also use user segmentation to tailor offers and messages to different groups.
Tracking key events and using funnel analysis lets businesses find out where users drop off. This way, they can improve the steps users take to reach a goal. Web analytics for business growth makes it easier to make better choices every day.
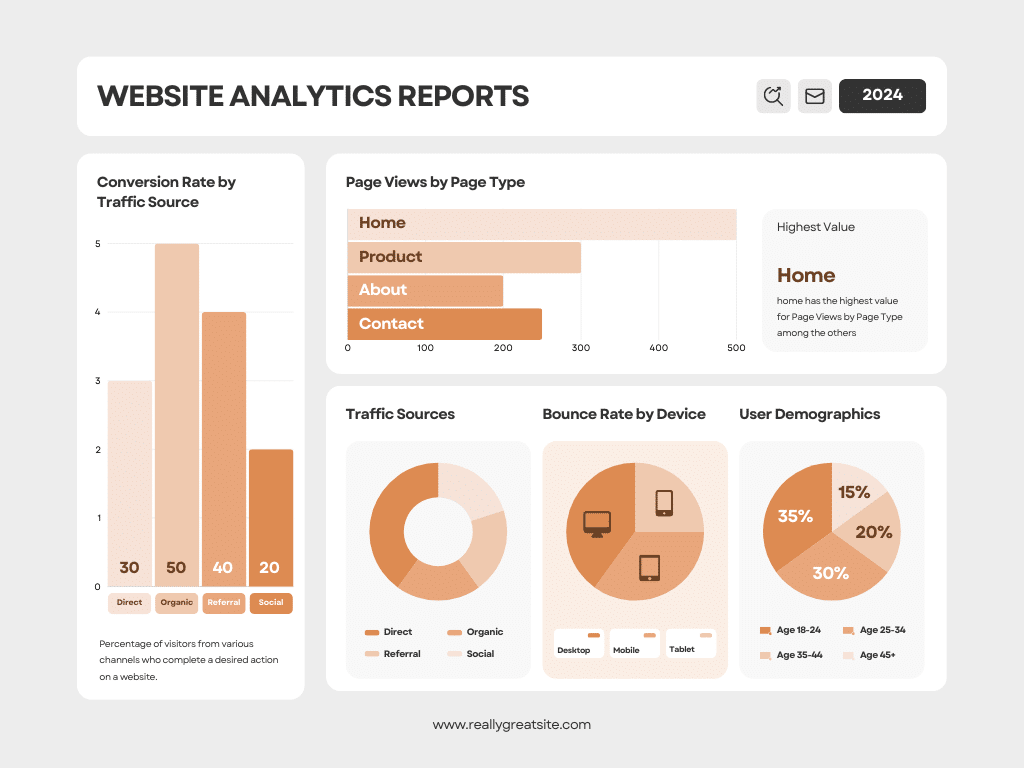
How modern web analytics works behind the scenes
Collecting and Tracking Website Data
Modern web analytics starts with data collection. Tools like Google Analytics 4, Adobe Analytics, and Matomo add small pieces of code to every web page. These codes are called tracking tags or pixels.
They collect details about each visitor, such as traffic sources, bounce rate, and engagement metrics. Every time a user clicks, scrolls, or fills a form, website analytics tools record these actions as key events.
Website analytics uses enhanced measurement to automatically track many actions on a site. Event tracking helps businesses see which pages get visits, how long people stay, and what they do next. Customer journey analytics uses this data to map the path users take from first visit to final goal, helping businesses understand the full journey.
Analyzing User Behavior and Performance
After collecting data, digital analytics platforms process and organize it. Tools like website traffic analysis and behavior analytics break down visits, showing patterns in user behavior.
Conversion tracking and funnel analysis help businesses find points where users leave or complete important steps. This process leads to conversion rate optimization by spotting areas where the site can improve.
Web analytics metrics such as bounce rate, page views, and session duration show how engaging and useful a website is. User segmentation lets businesses group visitors by location, device, or actions. This helps businesses tailor content and offers for different groups, making the experience better for everyone.
Advanced Measurement and Privacy
Modern web analytics cares about privacy. Tools use server-side tagging and consent mode to protect user data. These methods help businesses follow privacy laws and build trust with visitors. Privacy-friendly analytics platforms, like Matomo, also let companies keep more control over their data.
Integration with platforms like Google Search Console connects website analytics with search performance. Data-driven attribution and attribution modeling show which channels and touchpoints drive the most value.
Businesses use these insights to plan marketing, improve website performance metrics, and grow faster.
The website performance metrics that actually predict growth
Core Website Performance Metrics
Web analytics for business growth depends on measuring the right website performance metrics. Some metrics matter more than others when tracking growth. Key metrics include bounce rate, conversion rate, and engagement metrics. Bounce rate shows how many visitors leave quickly, which signals if content connects with users.
Conversion rate tells how many visitors complete important actions, like signing up or buying. Engagement metrics track how deeply users interact with site features, like page views and session duration.
Website analytics tools like Google Analytics 4, Matomo, and Adobe Analytics help track these key events. Enhanced measurement and event tracking allow businesses to capture important user actions. Website traffic analysis also tracks where users come from, called traffic sources. By knowing which channels drive traffic, businesses can focus efforts on what works best.
Metrics That Predict Growth
Some website performance metrics stand out as true growth predictors. Conversion tracking and funnel analysis are vital for understanding where users drop off. Funnel analysis maps the customer journey, helping businesses find and fix weak spots.
User segmentation lets teams group visitors by traits or actions, making analysis more precise. Data-driven attribution and attribution modeling reveal which channels really drive conversions.
Customer journey analytics tracks how users move through a site. Metrics like session length and repeat visits show how engaged visitors are. Server-side tagging and consent mode help gather these insights while protecting user privacy. Privacy-friendly analytics options ensure data is safe and trusted.
Turning Metrics Into Insights
Web analytics metrics are most useful when turned into clear insights. Tools like Google Search Console show how a site appears in search, highlighting growth areas. Behavior analytics and user behavior analytics dig deep into how people use a site. Key events and enhanced measurement help spot what drives action.
Website traffic analysis, when combined with event tracking, shows patterns over time. Businesses can use these metrics to guide conversion rate optimization. By tracking and understanding these metrics, businesses can use digital analytics to fuel real growth.
Turning analytics into insight with segmentation, funnels, and journeys
Using Segmentation for Deeper Understanding
Segmentation is a core part of web analytics for business growth. It lets you break down your audience into groups based on their behavior, location, traffic sources, or device type. This is helpful in website analytics because you can see which groups visit most often or have higher bounce rates.
By using user segmentation in tools like Google Analytics 4, Matomo, or Adobe Analytics, you can compare how different visitors interact with your site. Segmentation helps you focus your marketing, making your digital analytics more effective.
For example, segmenting by traffic sources shows which channels bring in more engaged users. You might find that users from Google Search Console have lower bounce rates or that social media visitors stay longer.
With behavior analytics and event tracking, you can spot patterns, such as which group completes key events or uses certain features more. These insights help guide content updates and campaign planning.
Funnel Analysis and Conversion Tracking
Funnels map out the steps users take before completing a goal, like making a purchase or signing up. Funnel analysis is a popular method in website analytics to watch how many users move through each step. Google Analytics 4, with its enhanced measurement and key events, makes it easy to build funnels and use conversion tracking. This helps find out where users drop off and which pages work best for conversion rate optimization.
With data-driven attribution and attribution modeling, you see which traffic sources help most with conversions. Funnel tables often show each stage with web analytics metrics like number of users, conversion rate, or average session duration. For example:
| Funnel Step | Users Entered | Users Converted | Conversion Rate |
|---|---|---|---|
| Product View | 1,000 | 600 | 60% |
| Add to Cart | 600 | 250 | 41.7% |
| Checkout | 250 | 100 | 40% |
Examining these numbers helps businesses adjust website performance metrics and improve the path to purchase.
Mapping Customer Journeys
Customer journey analytics shows the full path users take on your website. It combines behavior analytics, user behavior analytics, and enhanced measurement to track every touchpoint. Using consent mode and privacy-friendly analytics, platforms like Adobe Analytics or server-side tagging can keep data safe.
Tracking journeys helps spot where users get stuck or find what leads them to finish key events.
By following journeys, companies see which website traffic analysis strategies work best. They can update content, fix weak points, and boost engagement metrics.
Mapping journeys is key for making sure users have a smooth experience, which leads to higher conversions and better business growth.
Using analytics to improve SEO, content performance, and on-site experience
Boosting SEO with Web Analytics
Web analytics is important for improving SEO. Tools like Google Analytics 4 and Google Search Console help track website traffic analysis and traffic sources. They show which pages attract the most visitors and which search terms bring users to your site. By studying web analytics metrics like bounce rate and engagement metrics, you can find out what content works best for search engines.
A table can help compare key SEO metrics:
| SEO Metric | Description |
|---|---|
| Traffic Sources | Where users come from |
| Bounce Rate | % who leave after one page |
| Engagement Metrics | Time spent and pages viewed |
| Key Events | Important user actions |
With this information, you can adjust keywords and topics to match user interests. Using website analytics and digital analytics, you can also see how changes to your pages affect search rankings. Server-side tagging and consent mode options support privacy-friendly analytics tracking for compliance.
Enhancing Content Performance
Website analytics for business growth means checking which content gets the most attention. Tools like Matomo and Adobe Analytics provide behavior analytics, event tracking, and user segmentation.
These tools show which blog posts or articles are popular and which are ignored. Enhanced measurement and key event data help identify top-performing content.
Use conversion tracking and funnel analysis to see if content leads to sign-ups or sales. A/B testing pages can reveal what layout or headline works best. Tracking engagement metrics helps decide where to place calls to action.
The goal is to use data-driven attribution and attribution modeling to understand how each piece of content fits in the customer journey.
Improving On-Site Experience
User behavior analytics and customer journey analytics show how visitors move through your site. By watching web analytics metrics like session duration, navigation paths, and exit pages, you can spot issues that block users. Conversion rate optimization uses this data to make changes that encourage more sales or sign-ups.
Create lists of improvements based on website performance metrics:
- Speed up slow-loading pages
- Fix broken links
- Make buttons easier to find
- Simplify navigation
By using privacy-friendly analytics and respecting user consent, you ensure data is collected safely. Digital analytics tools, combined with server-side tagging, help create a smoother, more satisfying experience for every visitor.
Choosing the right web analytics tools without overbuying or under-tracking
Understanding Your Web Analytics Needs
Start by listing what you want to measure with web analytics for business growth. Consider key events like purchases, sign-ups, and traffic sources. Think about web analytics metrics such as bounce rate, page views, and conversion rates.
Decide if you need basic website analytics or advanced digital analytics. For some, simple website traffic analysis is enough. For others, customer journey analytics and funnel analysis are important. Make a list of what your site needs before choosing a tool.
Comparing Popular Website Analytics Tools
Here is a table to compare popular analytics tools:
| Tool | Key Features | Best For |
|---|---|---|
| Google Analytics 4 | Enhanced measurement, event tracking , data-driven attribution, user segmentation | Most websites |
| Matomo | Privacy-friendly analytics, server-side tagging, detailed behavior analytics | Privacy-focused sites |
| Adobe Analytics | Deep user behavior analytics, custom web analytics metrics, integration with other Adobe tools | Large enterprises |
| Google Search Console | Website performance metrics, traffic analysis, search-focused insights | SEO and website performance |
Choose a tool that matches your goals. If you want strong privacy, Matomo offers privacy-friendly analytics. For data-driven attribution and event tracking, Google Analytics 4 is a common choice.
If you need deep user behavior analytics or work in a big company, Adobe Analytics works well. For search data and website performance metrics, Google Search Console is useful.
Getting the Right Features Without Overbuying
Avoid buying more than you need. Focus on features that match your business size and goals. Small businesses may only need conversion tracking, engagement metrics, and basic event tracking. Larger companies may need user segmentation, attribution modeling, and server-side tagging.
Check if your tool supports consent mode for privacy or enhanced measurement for more detail. Use funnel analysis and conversion rate optimization to better understand the customer journey.
Always make sure you are not missing key data, but also do not pay for features you will not use. With the right website analytics, you can track website traffic analysis and improve business growth without waste.

Google Analytics 4 for broad measurement, events, and attribution
How Google Analytics 4 Improves Website Analytics
Google Analytics 4 (GA4) is a key tool for website analytics and digital analytics. GA4 helps businesses track website traffic, monitor engagement metrics, and understand user behavior analytics across their sites.
With enhanced measurement, GA4 collects data on user actions, such as page views, scrolls, and video plays, which are called key events. This makes website performance metrics simple to follow and allows for real-time updates on how users interact with your content.
GA4 also offers privacy-friendly analytics, supporting features like server-side tagging and consent mode. These ensure that data collection stays compliant with privacy laws. This is important for businesses that want to balance website traffic analysis and customer privacy. Tools like Google Search Console, Matomo, and Adobe Analytics can also work alongside GA4 for a full picture of web analytics for business growth.
Event Tracking and User Segmentation
Event tracking in GA4 helps businesses see exactly how users move through their websites. It goes beyond traditional page view counts by logging actions such as clicks, sign-ups, and downloads. Event tracking supports conversion tracking and funnel analysis, allowing companies to see where users drop off or complete goals.
With user segmentation, GA4 enables grouping visitors by traffic sources, behavior patterns, or device type. Businesses use these groups to perform behavior analytics and customer journey analytics.
This helps spot trends, measure bounce rate, and guide conversion rate optimization. Marketers can then use attribution modeling to see which channels drive the most value.
Attribution Modeling and Data-Driven Insights
Attribution modeling in GA4 uses data-driven attribution to show which marketing steps matter most in user journeys. Businesses see the full path users take, from first visit to final sale. Attribution modeling in GA4 covers touchpoints across paid ads, search, social, and direct traffic.
This deep insight into web analytics metrics helps companies improve strategies for business growth. GA4’s reports make it easier to compare campaign performance, set goals, and measure results.
GA4’s integration with other tools, like Google Search Console or Adobe Analytics, adds more layers to website traffic analysis and performance tracking.
| GA4 Feature | Benefit |
|---|---|
| Enhanced measurement | Tracks key events easily |
| Event tracking | Monitors user actions |
| User segmentation | Groups visitors by behavior |
| Data-driven attribution | Improves marketing effectiveness |
A practical tool-selection checklist by business size, complexity, and compliance needs
Choosing Web Analytics Tools by Business Size
Selecting web analytics tools depends on business size. Small businesses may start with Google Analytics 4 for basic website analytics. It offers event tracking, funnel analysis, and conversion rate optimization. GA4 also supports conversion tracking and enhanced measurement of key events.
Medium-sized companies might need more advanced analytics. Tools like Matomo or Google Search Console track website traffic, user segmentation, and traffic sources. These platforms allow for deeper behavior analytics and bounce rate monitoring.
For large enterprises, Adobe Analytics or Quantum Metric offer enterprise-grade features. These tools provide advanced web analytics metrics, user behavior analytics, and customer journey analytics. They also support website performance metrics and complex attribution modeling.
Matching Tools to Complexity and Business Goals
The complexity of your website affects the best tool choice. Basic sites benefit from simple website traffic analysis and event tracking in Google Analytics 4. Sites with many features need advanced digital analytics tools that support conversion rate optimization and detailed engagement metrics.
If your goal is to optimize user experience, pick tools with strong funnel analysis and customer journey analytics. These tools help identify areas where users drop off. Enhanced measurement lets you track key events and improve user segmentation.
For businesses focused on detailed attribution, tools with data-driven attribution and attribution modeling are important. They reveal which channels drive conversions. This helps refine marketing strategies and track conversion tracking across sources.
Ensuring Compliance and Privacy
Privacy and compliance are key in web analytics for business growth. Small businesses might use Google Analytics 4 with consent mode for privacy-friendly analytics. Server-side tagging can also enhance data privacy.
Medium and large businesses should look for analytics tools that handle user consent and data protection. Matomo is a popular choice for privacy-focused website analytics. It allows control of data storage and supports compliance with regulations.
Adobe Analytics and Quantum Metric offer strong compliance features. They include privacy controls, consent management, and detailed reporting. This ensures safe website traffic analysis and protects user data while tracking web analytics metrics.
Building reporting habits stakeholders trust and act on
Making Web Analytics Reports Clear and Reliable
Web analytics reports matter for business growth. They help teams see what is working on a website. Reports from tools like Google Analytics 4, Matomo, or Adobe Analytics show website traffic analysis, bounce rate, and other web analytics metrics.
When teams trust reports, they use the data to make choices. This is why using clear, easy-to-read reporting is key.
Teams should focus on important metrics. These include engagement metrics, conversion tracking, and user segmentation. By sharing these web analytics for business growth, teams can spot trends in user behavior analytics.
Regular updates help everyone understand the customer journey. Funnel analysis and conversion rate optimization become easier when data is clear.
Building Good Reporting Habits
Good habits start with a routine. Stakeholders need to see reports at the same time each week or month. This builds trust in the data. Use simple charts and tables. For example, a table can break down traffic sources, bounce rates, and website performance metrics:
| Metric | This Month | Last Month |
|---|---|---|
| Page Views | 50,000 | 47,000 |
| Bounce Rate (%) | 45 | 48 |
| Conversions | 2,000 | 1,700 |
Always include key events and event tracking to show what matters most. Use enhanced measurement features in Google Analytics 4 for better tracking. Server-side tagging and privacy-friendly analytics help keep user data safe. Consent mode also builds user trust.
Helping Stakeholders Take Action
Stakeholders need to know what to do next. After seeing website analytics, suggest actions. For example, if conversion rate drops, use customer journey analytics to find out why. If a page has a high bounce rate, test new content. Funnel analysis helps spot where users leave the website.
Share clear steps. For example:
- Improve slow pages using website performance metrics
- Use attribution modeling to see which channels drive sales
- Optimize key events by tracking user behavior analytics
Using tools like Google Search Console alongside web analytics gives a full picture. Regular, simple reports with clear actions help teams improve results quickly.
KPI dashboards for executives, marketers, content teams, and product owners
Executive Dashboards: Strategic Insights at a Glance
Web analytics dashboards for executives offer a high-level view of website performance metrics. These dashboards focus on big picture data like total website traffic analysis, bounce rate trends, and top traffic sources.
Key web analytics metrics, such as conversion rate optimization and attribution modeling, show how the site supports business goals. Tools like Google Analytics 4, Adobe Analytics, and Matomo help visualize these statistics. With enhanced measurement and data-driven attribution, executives see how changes affect business growth.
A table on an executive dashboard might include:
| Metric | This Month | Last Month |
|---|---|---|
| Total Visits | 85,000 | 77,000 |
| Bounce Rate (%) | 38 | 41 |
| Conversion Rate (%) | 6.2 | 5.8 |
Dashboards provide alerts for sudden traffic changes or key events. Automated reports keep leaders updated so they can respond quickly. This helps guide decisions for web analytics for business growth.
Marketer and Content Team Dashboards: Tracking Engagement and Campaigns
Marketers rely on website analytics dashboards to monitor traffic sources and campaign results. They look at web analytics metrics like traffic sources, user segmentation, and event tracking.
Customer journey analytics and funnel analysis help marketers see where users come from and how they move through the site. Conversion tracking and engagement metrics, like average session time and click rates, highlight what drives results.
Content teams benefit from behavior analytics to study user interests. Bounce rate, page views, and engagement metrics show which content attracts visitors. Google Search Console data helps find top-performing search keywords.
Teams can use server-side tagging and privacy-friendly analytics to collect data accurately while respecting consent mode and privacy.
Tables and charts on these dashboards show:
- Top landing pages
- Sessions by channel (organic, paid, social)
- Key events, like downloads or shares
Product Owner Dashboards: Understanding User Behavior and Performance
Product owners use digital analytics dashboards to watch user behavior analytics, website performance metrics, and user journeys. Event tracking highlights key actions, such as signups or purchases. Funnel analysis shows where users drop off, helping teams fix pain points. Web analytics for business growth means tracking feature adoption and retention.
Product dashboards also link to conversion rate optimization tools and enhanced measurement features in Google Analytics 4 or Matomo.
By analyzing user segmentation and specific event data, product owners can spot trends and issues. Integration with tools like Google Search Console or Adobe Analytics provides more details on technical performance and search visibility.
A sample table could track:
| Feature | Users Interacted | Conversion Rate (%) |
|---|---|---|
| Wishlist | 5,200 | 12 |
| In-App Chat | 2,800 | 8 |
| Checkout Flow | 3,600 | 15 |
The future of web analytics is privacy-aware, first-party, and more predictive
Privacy-Focused Web Analytics
Web analytics is changing. People care about privacy, so businesses must use privacy-friendly analytics tools. Website analytics often now relies on first-party data, collected directly from users with their consent. Tools like Google Analytics 4, Matomo, and Adobe Analytics support consent mode and server-side tagging. These features help protect user privacy and keep data secure. Companies now focus on being open about what data they collect. This helps build trust with website visitors. Privacy-friendly analytics ensures websites can still understand traffic sources, bounce rate, and key engagement metrics while respecting users.
First-Party and Predictive Data
First-party data means information you get straight from users. Digital analytics is moving away from third-party cookies. First-party data lets businesses track key events and use event tracking safely. With Google Analytics 4, enhanced measurement and conversion tracking rely on first-party data.
This approach allows for better attribution modeling and data-driven attribution. Customer journey analytics uses this safe data to understand how people move through a site. Predictive tools can guess what users might do next. This helps with conversion rate optimization and funnel analysis, making websites better at turning visits into sales.
Smarter Analysis and Action
Website analytics now uses new ways to find patterns. Tools like Google Search Console and Adobe Analytics offer deep insights. User segmentation, behavior analytics, and user behavior analytics allow businesses to see how different groups use their site. Tables can help track important web analytics metrics:
| Metric | What It Shows |
|---|---|
| Traffic Sources | Where visitors come from |
| Bounce Rate | Who leaves quickly |
| Engagement Metrics | How users interact |
| Website Performance | Speed and load times |
These metrics drive better website traffic analysis and conversion rate optimization. By using smart website traffic analysis, businesses can improve user journeys. First-party and predictive analytics make it easier to spot trends and fix problems fast.
What consent mode and server-side tagging change for marketers and analysts
How Consent Mode Impacts Data Collection
Consent mode helps businesses follow privacy laws when collecting website analytics data. It lets marketers adjust what data Google Analytics 4 and other tools collect based on if a user gives permission. This is important for privacy-friendly analytics and for building trust with users.
With consent mode, key events and event tracking may be limited if users do not agree. Marketers might see less data for attribution modeling or conversion tracking. Still, consent mode helps balance user privacy and the need for website traffic analysis.
What Server-Side Tagging Brings to Digital Analytics
Server-side tagging is a new way to collect and send web analytics data. Instead of sending data straight from the user’s browser, information goes to a secure server first. This helps marketers and analysts get better control over data quality and privacy.
With server-side tagging, website analytics can reduce data loss from ad blockers or browser limits. It also helps with enhanced measurement, user segmentation, and customer journey analytics. Server-side tagging works well with tools like Google Analytics 4, Matomo, and Adobe Analytics.
Changes in Attribution and Measurement
Consent mode and server-side tagging make attribution modeling and data-driven attribution more complex. Some website traffic analysis data may be missing if users do not give consent. Marketers must use behavior analytics and engagement metrics to fill in the gaps.
Conversion rate optimization, funnel analysis, and bounce rate tracking may also be affected. Server-side tagging helps improve website performance metrics by making data collection more reliable.
Marketers now rely on a mix of Google Search Console, enhanced measurement, and event tracking to understand traffic sources and user behavior analytics.
Table: Impact of Consent Mode and Server-Side Tagging
| Feature | With Consent Mode | With Server-Side Tagging |
|---|---|---|
| Data Collection | Limited if no user consent | More reliable, less data loss |
| Privacy | Improved user privacy | Stronger data control |
| Attribution Modeling | May have gaps in data | More complete data for modeling |
| Website Analytics Tools | Needs privacy compliance | Better integration with analytics |