

A Google Maps ranking check sounds simple. Search for your service, find your business, and note the position.
That method can produce a number. It rarely produces reliable data.
Your business may appear first when you search from the office. A customer two miles away may see it in seventh place. Someone on the other side of town may not see it within the first 20 results. All three results can be valid at the same time.
Local search results depend heavily on context. The searcher’s location matters. The wording of the query matters. Device type, language, timing, competition, and search history can also affect what appears.
That is why a business does not have one universal Google Maps rank. It has a distribution of positions across different keywords, locations, and moments.
Accurate tracking requires more than opening Maps once a month. You need a repeatable measurement process. The same keywords must be checked from the same geographic points. The grid dimensions, radius, search surface, language, device, and scan schedule must remain consistent. Results should then be compared with competitor visibility and real business outcomes.
This guide explains that complete process. It covers manual checks, geo-grid tracking, local search heatmaps, reporting metrics, competitor comparisons, service-area businesses, franchises, ranking drops, and conversion measurement.
The goal is not to produce a flattering ranking screenshot. The goal is to understand where customers can find you, where they cannot, and what action should follow.
What Does a Google Maps Ranking Check Actually Measure?
A ranking check measures where a specific Google Business Profile appears for a specific search query from a specific location.
Every part of that definition matters.
The profile must be identified correctly. The search query must remain exact. The location must be known. The search surface must also be clear. A profile can appear differently in the local pack shown in Google Search, the expanded Local Finder, and the Google Maps interface.
A result such as “position four” has little meaning without that context.
A useful ranking record would look more like this:
“Business A ranked fourth in Google Maps for ‘emergency plumber’ from a coordinate 1.2 miles northwest of its verified location at 10:00 a.m. on a mobile search.”
That description is longer, but it is measurable. Another analyst could repeat it.
Google Maps Rank Checker vs Google Maps Rank Tracker
A Google Maps rank checker usually performs a one-time test. It tells you where a business appears at one point or across a limited group of map points.
A Google Maps rank tracker repeats those checks over time. It stores historical scans, highlights movement, monitors competitors, and may generate reports automatically.
The distinction matters because one scan cannot establish a trend.
A one-time checker is useful when you need to confirm whether a profile appears for a query. It can also help investigate a sudden complaint, test a new location, or perform a quick prospect audit.
A tracker is better when you need to measure progress. It can show whether visibility expanded after a category change, website update, review campaign, relocation, or local content project.
The same distinction applies to a general local rank tracker and a full local SEO rank tracker. Some platforms monitor only Google Maps. Others track local packs, localized organic results, Bing positions, multiple devices, and several business locations.
Choose the tool based on the decision you need to make. Do not choose it because the heatmap looks impressive.
Google Business Profile Ranking, Local Pack Rankings, and Organic Results
A Google Business Profile ranking is not the same as an organic website ranking.
A profile can rank well in Maps while the website ranks poorly below the local results. The reverse can also happen. A strong local landing page may appear organically even when the associated Business Profile does not enter the top three.
Local pack rankings refer to the small group of local business results shown directly within Google Search. This group is often called the three-pack or Map Pack.
Google Maps may show a longer list. The expanded Local Finder can also present more profiles than the initial pack. Organic results appear separately and are tied mainly to web pages rather than profile positions.
A Map Pack rank tracker should state which surface it measures. Some tools track the initial three-pack. Some collect Maps positions. Others track Maps, local packs, and organic results separately.
Do not merge those numbers into one vague “Google ranking.” Each surface behaves differently and supports a different type of visibility.
Why Google Maps Rankings Change From One Searcher to Another
Local results are designed to help people find useful businesses near the location relevant to their search.
That means two customers can use the same phrase and receive different results.
A search for “dentist” from a downtown office may favor clinics near downtown. The same search from a residential neighborhood may return another group. A search for “dentist near central station” adds an explicit geographic cue and may change the result again.
This variability is not a tracking error. It is a core feature of local search.
Google Maps Ranking Factors: Relevance, Distance, and Prominence
The central Google Maps ranking factors can be grouped into relevance, distance, and prominence.
Relevance concerns how well a business matches the search. Categories, services, business information, website content, and other signals can help Google understand what the business offers.
Distance concerns how far a possible result is from the location used for the search. If the user does not enter a location, Google estimates which location is relevant.
Prominence concerns how established or well known a business appears. Information from across the web can contribute. Reviews, links, articles, directories, and organic search strength may all help Google assess prominence.
These factors work together. A nearby business is not guaranteed to rank first. A more relevant or prominent competitor may outrank it. A highly authoritative business may still lose visibility as the search point moves farther away.
This is why local SEO cannot remove geography from the equation. Optimization can improve relevance and prominence. It cannot make physical distance disappear.
Rank by Location: Why Hyperlocal Rankings Change Street by Street
To rank by location means evaluating the business from several real or simulated search points rather than one citywide setting.
This is the foundation of hyperlocal rank tracking.
A business may perform well north of its address but poorly to the south. One neighborhood may contain several strong competitors. Another may have little competition. Roads, bridges, commercial districts, population density, and neighborhood boundaries can shape the visible pattern.
The search performed inside the business is often the least useful test. It tends to show performance from the point where proximity is strongest.
Owners then assume customers across the city see the same result.
They do not.
A useful measurement system should include points where customers live, work, travel, or request the service. It should represent the actual market, not only the business address.
Device, Language, Personalization, Search History, and Time
Location is the largest reason local results differ, but it is not the only one.
Google can use language and device context to improve results. Search activity and saved account information may also influence what a person sees. Incognito mode reduces some account-based personalization, but it does not remove the searcher’s location or all contextual signals.
Mobile and desktop interfaces can display local results differently. Screen size can change how many businesses appear before scrolling. App and browser results may also feel different even when the underlying order is similar.
Timing can matter as well. Competition changes. Profiles are edited. Reviews arrive. Businesses open and close. Google systems refresh. Ranking tools may collect results at different moments.
This does not mean every change is significant. It means accurate measurement must control as many variables as practical.
Decide What You Need to Track Before Checking Rankings
Most tracking mistakes begin before the first scan.
The business chooses too many keywords, uses an arbitrary citywide grid, and measures every term as if it has equal value. The resulting dashboard looks comprehensive but does not support good decisions.
Start with the business objective.
A dentist may care most about implant, emergency, cosmetic, and family dentistry queries. A law firm may prioritize high-value practice areas. A restaurant may care about cuisine, meal type, delivery, and neighborhood searches.
The correct tracking set reflects how the business earns revenue.
Build a Local Keyword Rank-Tracking Set Around Revenue-Producing Services
Effective local keyword rank tracking starts with services that matter commercially.
A keyword deserves priority when it represents a real offering, matches customer language, and can lead to a valuable action. Search volume matters, but it should not be the only filter.
A lower-volume term may produce better leads. “Commercial boiler repair” may bring fewer searches than “boiler repair,” but each qualified inquiry could be worth much more.
Group keywords by service line. Record the landing page, Business Profile category, typical customer, lead value, and target area for each group.
This creates a connection between rankings and strategy. When one group improves, you can assess whether the relevant service also gains leads.
Avoid adding distant variations that express the same intent without changing the result. Tracking “plumber near me,” “plumbers near me,” and “nearby plumber” may produce useful differences in some markets. In others, they may create unnecessary cost and noise.
Test first. Keep variations that reveal distinct behavior.
Track Explicit-Local, Implicit-Local, and Near Me Keywords Separately
An explicit-local query contains a place name. “Accountant in Bristol” is explicit because the target location is written into the search.
An implicit-local query has local intent without naming the place. A search for “accountant” often produces nearby businesses because Google interprets the service as local.
A “near me” query makes proximity central. Near me rank tracking is useful because these searches can change sharply across short distances.
Do not assume these three query types behave identically.
A profile may rank well for “accountant Bristol” across a broad area because the city is part of the query. It may rank much less consistently for “accountant near me,” where the search point carries more weight.
Keep these keyword groups separate in reports. Otherwise, a strong explicit-location keyword can hide weak proximity-based visibility.
Separate Branded, Discovery, Service, and Emergency Queries
Branded searches include the company name or a close variation. They show whether people can locate a business they already know.
Discovery searches describe a product, category, or service without naming the business. These are usually more valuable for measuring new-customer visibility.
Service searches focus on a specific offering. Emergency queries add urgency, such as “24-hour locksmith” or “emergency dentist.”
Each group should have a different interpretation.
Strong branded rankings do not prove strong discovery visibility. A business should normally appear for its own name unless eligibility, duplication, verification, or entity confusion is present.
Discovery and service rankings reveal competitive reach. Emergency terms may behave differently because relevance, hours, and immediate proximity can become more important to the searcher.
How to Check Google Maps Rankings Manually for Free
Manual checks remain useful. They are fast, free, and easy to verify visually.
They are not suitable for measuring an entire market on their own.
A manual check captures one search context. It should be treated as a spot test, not a full visibility report.
Run an Incognito Google Maps Ranking Check
A simple manual process looks like this:
- Open a private or incognito browser window, confirm the location Google is using, and search the exact target keyword.
- Check the local pack in Google Search, then run the same query in Google Maps.
- Record the date, time, device, language, observed location, search surface, and business position.
Incognito mode reduces the influence of an active account and some browsing history. It does not make the search location neutral.
If you search from the business premises, the result still reflects that location. If your internet connection is assigned to the wrong city, the result may reflect an inaccurate location estimate.
Manual checking is best for validating a tool result, confirming that the correct profile appears, or investigating a specific grid point.
Simulate a Different Search Location
You can move the map, search within a target neighborhood, or use browser location controls to approximate another search point.
These methods are useful for investigation. They are difficult to repeat at scale.
A browser setting may not perfectly reproduce the environment used by an ordinary customer. The search engine can use several location signals. A changed pin or developer setting may affect one signal without replacing every other source of location context.
Manual location simulation also creates recording problems. Analysts may move the point slightly between checks. Small coordinate changes can matter in competitive areas.
Use manual simulation for validation. Use a controlled geo-grid rank tracker for recurring multi-point measurement.
Use Google Business Profile Performance and Search Console Correctly
Google Business Profile Performance helps you understand how people discover and interact with a profile. It can report search terms, views, calls, website clicks, directions, messages, bookings, and other available interactions.
This data is valuable because it reflects real exposure and engagement.
It does not provide a precise rank for every searcher location.
A search term can appear in profile performance even when your own manual search does not show the business in the same position. Your test and the recorded user impressions may have occurred in different places, on different devices, and at different times.
The same caution applies to Google Search Console average position.
Search Console reports the average topmost position of your website property across impressions. It is designed for web-search performance. It should not be treated as an exact Google Maps position.
Use Business Profile Performance for profile discovery and interactions. Use Search Console for website visibility. Use geo-grid tracking for location-specific Maps positions.
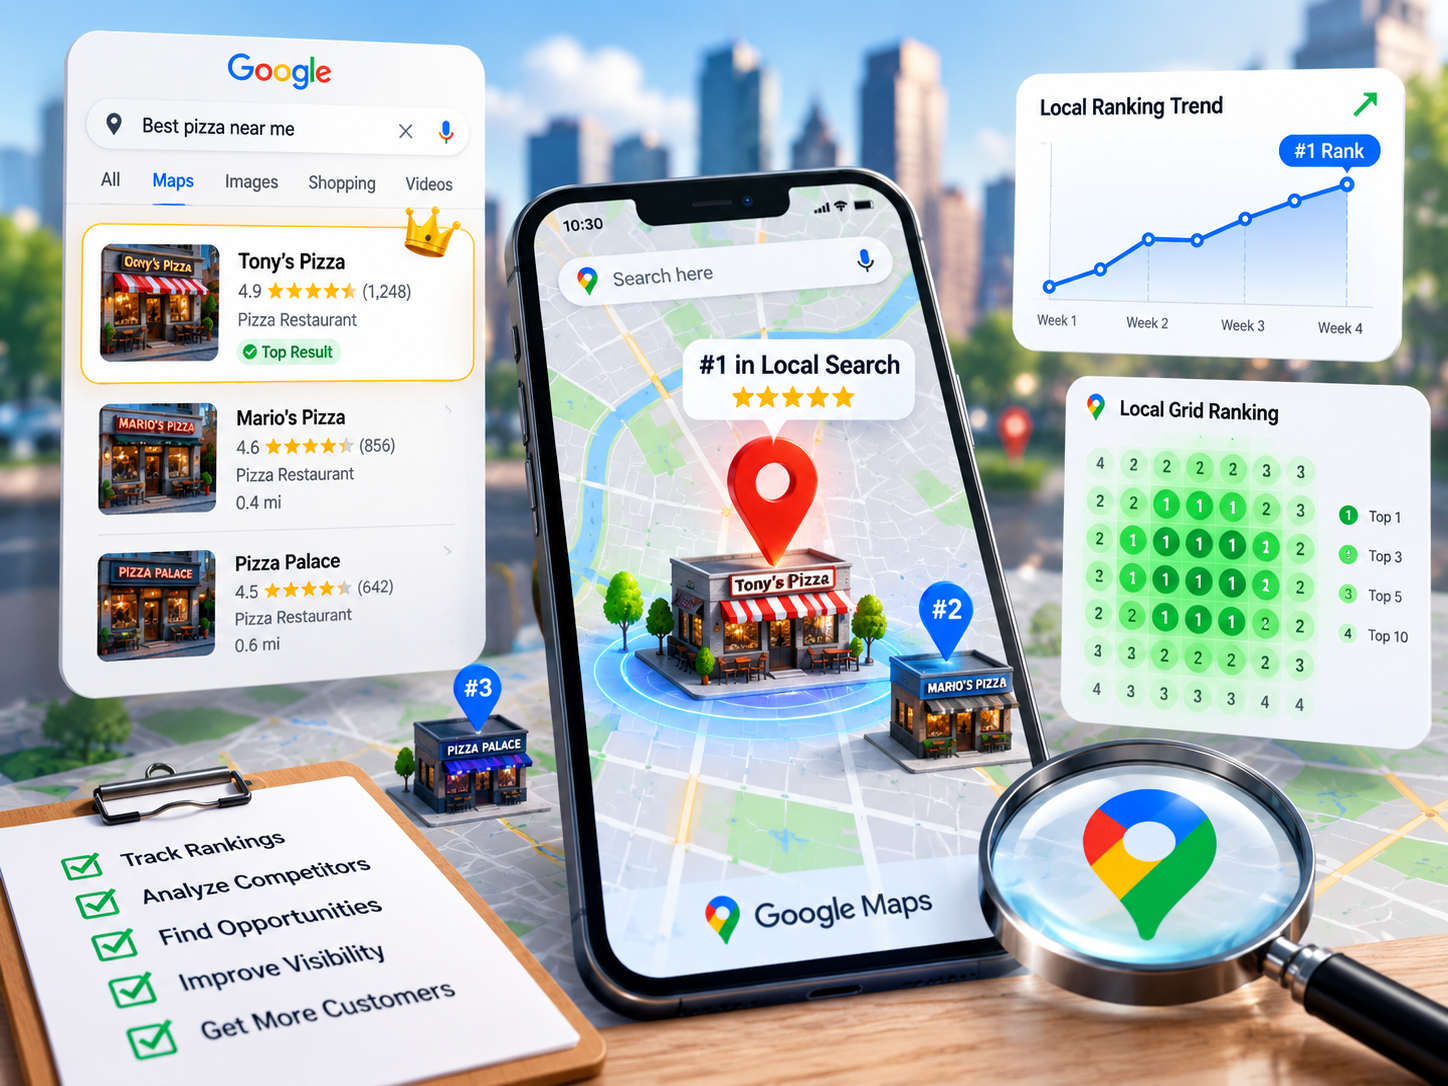
How a Geo-Grid Rank Tracker Produces a Google Maps Ranking Heatmap
A geo-grid system places a set of search points over a map. It checks the same keyword from each point and records the profile’s position.
The output is usually a Google Maps ranking heatmap.
Each point displays a number and often a color. Low position numbers may appear green. Weaker positions may appear yellow, orange, or red. A point where the profile is not found within the tool’s tracking depth may show a warning color or a greater-than symbol.
This visual format makes geographic variation easy to understand.
How Local Search Grid Points Simulate Rank by Location
A local search grid might contain 9, 25, 49, 81, or more points. Each point represents a coordinate.
The tool runs or simulates a localized search at each coordinate. It then looks for the target Business Profile within the returned results.
The result is more informative than one city-center check because it shows how visibility changes across the area.
A grid does not create one official ranking. It samples several positions.
This is a crucial distinction. The map is a measurement model. Its quality depends on where the points are placed, how many are used, how the searches are executed, and whether the configuration stays consistent.
Choose the Right Grid Size and Radius
The correct grid size and radius depend on the business model and market.
A coffee shop may need a tight grid because customers usually travel a short distance. A specialist medical practice may draw patients from a wider area. A rural contractor may need several dispersed grids rather than one dense urban grid.
Grid size describes the number of points, such as 5 by 5 or 7 by 7. Radius describes the geographic area those points cover.
A large radius with few points creates wide gaps. It may miss important neighborhood changes. A dense grid over an oversized area can become expensive and difficult to interpret.
The aim is not to use the largest grid available. The aim is to sample the market at a resolution that supports decisions.
Begin with the realistic customer catchment area. Then choose enough points to detect meaningful changes inside it.
Place the Grid Around Real Customer Demand, Not Empty Geography
A perfectly symmetrical grid may include useless locations.
Pins can fall over water, industrial land, airports, parks, mountains, military areas, or neighborhoods the business does not serve.
Those points can distort averages.
The grid should represent demand. A restaurant should emphasize residential, office, entertainment, and travel zones where customers search. A home-service company should cover neighborhoods that produce profitable calls. A medical practice should include population centers and referral areas.
Some tools allow analysts to deselect irrelevant pins. Use that feature carefully. Do not remove weak points merely to improve the report.
Document every excluded area and the reason for exclusion. A point should be removed because it is commercially irrelevant, not because the ranking is poor.
The Accuracy Protocol for Repeatable Google Maps Rank Tracking
A tracking system is only useful when results from different dates can be compared fairly.
If the grid changes between scans, the apparent improvement may come from easier points. If the keyword set changes, the average can rise without any individual keyword improving. If the radius shrinks, rankings often look stronger because more points sit close to the business.
Accuracy is not a permanent quality of the tool. It is the result of controlled configuration and disciplined interpretation.
Lock the Keyword, Coordinates, Grid, Radius, Search Surface, and Language
Every recurring campaign should have a written measurement specification.
| Measurement control | What must be recorded and kept consistent |
|---|---|
| Target profile | Exact business profile, location identifier, address status, and matching method |
| Keyword | Exact wording, spelling, language, and keyword group |
| Search surface | Google Maps, local pack, Local Finder, or localized organic search |
| Grid configuration | Center coordinate, dimensions, point count, spacing, and excluded points |
| Geographic scope | Radius, unit of distance, target neighborhoods, and demand zones |
| Search context | Country, language, device type, desktop or mobile setting |
| Scan timing | Date, day, time window, frequency, and business open or closed status |
| Ranking depth | Maximum number of results checked at each point |
| Comparison set | Named competitors and rules for adding or removing them |
| Change log | Profile edits, website releases, review activity, moves, campaigns, and known incidents |
This table should become part of every client or internal ranking project.
When a setting changes, create a new baseline. Do not quietly append the new scan to the old trend.
Set a Consistent Google Maps Scan Frequency and Timing
Google Maps scan frequency should match the speed of the decisions being made.
Weekly tracking is suitable for many active local SEO campaigns. It is frequent enough to detect patterns without encouraging daily overreaction.
Monthly tracking may be enough for stable businesses with limited campaign activity. Daily scans can help during a migration, suspension recovery, competitive incident, or controlled experiment. They also produce more noise and cost.
Run recurring scans within a consistent time window. Avoid comparing one scan from early Monday with another from late Saturday unless the timing difference is part of the test.
Business hours may affect user behavior and how some results are presented. Competitive conditions can also vary across the week.
Consistency does not remove all volatility. It makes the remaining movement easier to interpret.
Establish a Baseline Before Interpreting Movement
Do not call the first scan a benchmark and the second scan a trend.
Run repeated scans under the same conditions. Study the normal range. Some keywords are stable. Others move frequently.
A useful baseline can include several scans over two to four weeks, depending on campaign urgency and market volatility. When possible, compare medians or short rolling averages rather than relying on one isolated day.
Record the range as well as the average.
A business that moves between positions three and five is behaving differently from one that moves between positions three and eighteen, even if both produce the same average over a small sample.
How to Read a Local SEO Heatmap Without Misinterpreting It
A local SEO heatmap compresses dozens of ranking observations into one visual.
That convenience creates risk. Users can focus on color changes without asking what caused them or whether they matter commercially.
Read the pattern first. Then investigate possible causes. Do not reverse that order.
Interpret Bullseye, Patchy, One-Sided, and Isolated-Green Patterns
A bullseye pattern is strong near the business and gradually weaker farther away. This often reflects normal distance decay. It may also show limited prominence outside the immediate area.
A patchy map has strong and weak points mixed together. It may reflect competitor clusters, neighborhood differences, query interpretation, road patterns, or unstable data.
A one-sided pattern shows strength in one direction. Physical geography, population distribution, commercial centers, or concentrated competitors may explain it.
An isolated green point inside a weak grid deserves validation. It could represent a real pocket of visibility. It could also be an outlier.
Use the following framework as a starting point, not as automatic diagnosis.
| Heatmap pattern | Likely initial interpretation | Evidence to check before acting |
|---|---|---|
| Strong center with smooth outward decline | Normal proximity effect or limited reach beyond the immediate area | Competitor distance, review strength, links, website authority, and local demand |
| Weak across nearly every point | Relevance, eligibility, category, prominence, or severe competition issue | Profile status, categories, services, duplicates, website alignment, and manual searches |
| Strong in irregular pockets | Competitor clusters, neighborhood signals, volatility, or point-level anomalies | Repeated scans, competitor overlays, local geography, and manual verification |
| Strong on one side only | Uneven demand, physical barriers, commercial districts, or competitor distribution | Roads, bridges, population, neighborhood terms, competitor locations, and landing pages |
| Strong rankings with weak conversions | Low-value keyword, poor profile conversion, weak offer, or bad attribution | Calls, bookings, directions, website sessions, lead quality, and CRM revenue |
| Sudden widespread decline | Measurement change, profile issue, competitor shift, update, or listing conflict | Configuration log, verification, profile edits, duplicates, suspensions, and competitor movement |
Compare the Shape of Visibility, Not Only the Average
Two businesses can have the same average rank position and very different visibility.
Business A may rank fourth at every point. Business B may rank first near its address and fifteenth across the rest of the grid.
Their averages can look similar. Their customer reach is not.
The shape of the map reveals concentration and coverage. It shows whether visibility is stable, localized, fragmented, or dependent on one small area.
This is why average grid rank should never appear alone in a report.
Show the map, the distribution of positions, the percentage of top-three points, and the trend. Stakeholders need to see whether improvement came from broad market expansion or a few unusually strong pins.
Treat the Heatmap as a Symptom Report, Not a Causal Diagnosis
A heatmap shows where visibility is strong or weak. It does not prove why.
Poor results may be related to distance. They may also involve categories, services, reviews, links, landing pages, profile status, competitor strength, duplicate listings, spam, or a mismatch between the query and the business.
Do not see a red point and immediately build a neighborhood landing page. First inspect the competitors appearing there. Check their distance, categories, review profiles, websites, and local relevance.
The map identifies where investigation should begin.
It is not a substitute for investigation.
Google Maps Metrics That Matter More Than One Rank Number
A useful ranking report uses several metrics because each answers a different question.
The wrong response is to invent one composite score and hide the underlying data.
Report raw positions first. Then add summaries that help users compare time periods and competitors.
Average Rank Position and Average Grid Rank
Average rank position summarizes several observations into one number.
For a geo-grid, the average is calculated across scan points. If a profile appears at positions 2, 4, 6, 8, and 10, the average is 6.
The problem begins when the profile is not found.
Some tools assign a value beyond the tracking depth. Others omit the point. Some use a proprietary formula. These methods can produce different averages from the same visible map.
A report should explain how missing positions are treated.
Median rank can also be useful. It is less affected by a small number of extreme points. The full distribution should remain available so that no summary hides the pattern.
Share of Local Voice and Top-Three Coverage
Share of local voice estimates how much visibility a business holds across a defined grid or competitive set.
The precise formula can differ by platform. Some versions give greater weight to higher positions. Others measure visibility across points and competitors.
Do not compare the score across tools unless the calculation is known to be equivalent.
Top 3 coverage is easier to explain. It shows the percentage of relevant grid points where the profile ranks within the first three positions.
If a 25-point grid contains 10 top-three positions, top-three coverage is 40 percent.
This metric aligns well with local pack visibility, but it still needs context. A business may have excellent coverage in low-demand areas and poor coverage in its most valuable neighborhoods.
Add Demand-Weighted Local Search Visibility
Local search visibility should reflect both exposure and business relevance.
A raw grid treats every point equally. That is useful because it is transparent. Yet real markets are not evenly valuable.
A residential district may generate far more searches than an industrial area. One keyword may produce high-margin bookings. Another may attract information seekers who rarely convert.
A business-weighted score can account for these differences.
Assign a documented weight to each keyword group and priority zone. Calculate the weighted result alongside the raw result. Never replace the unweighted data.
The raw score protects integrity. The weighted score supports business decisions.
How to Track Competitor Rankings on Google Maps Fairly
Competitor rank tracking helps explain whether visibility changed because your business moved, competitors moved, or the result set changed across the market.
It also prevents an internal-only view of performance.
A profile can improve from position nine to six while still losing competitive share if rivals improve faster.
Use the Same Grid, Keywords, Timing, and Ranking Depth
Competitor comparisons require identical conditions.
Use the same keyword, coordinates, radius, timing, device, language, and search surface. Track the competitors in the same scan whenever the platform supports it.
Do not compare your 5-by-5 grid with a competitor’s 3-by-3 grid. Do not compare your city-center scan with a rival’s address-centered scan.
Ranking depth must also match. A tool that stops at position 20 cannot be compared directly with one that searches to position 100.
Fair comparison begins with common measurement.
Separate True Local Competitors From Directories, Chains, and Outliers
Not every profile appearing above you is a direct competitor.
A directory or lead-generation business may appear in some markets. National chains may compete for the same customers but operate with a different authority model. A practitioner profile may appear beside a clinic. Duplicate or spam listings may distort the result set.
Create clear inclusion rules.
A direct competitor usually offers the same core service to the same customer group within the same practical market. Track these businesses consistently.
Keep a separate watchlist for chains, directories, practitioners, duplicates, and suspected policy violations. They matter, but they should not silently enter and leave the primary competitive benchmark.
Measure Competitive Displacement by Neighborhood
A citywide average may show that three competitors perform well. A grid can reveal which competitor controls each neighborhood.
One rival may dominate near the city center. Another may lead in the northern suburbs. A third may rank broadly because it has strong prominence.
This information changes the strategy.
If one nearby competitor beats you at every weak point, compare profile relevance, reviews, website alignment, and authority. If different businesses win in different areas, geography may be the stronger explanation.
Competitive displacement analysis turns the map from a scorecard into a market model.
Multi-Location Rank Tracking for Franchises and Location Portfolios
Multi-location rank tracking is not the same as running one local campaign many times.
Every branch operates in a different competitive environment. Population density, customer behavior, review expectations, local language, travel patterns, and service demand can vary.
A portfolio report must preserve local detail while allowing management to identify patterns across the network.
Build a Separate Keyword and Grid Model for Each Location
A franchise may have a core national keyword set. Each branch should also have local variations.
One location may offer a service unavailable elsewhere. Another may serve a bilingual market. A branch in a city center may need a tight grid, while a suburban branch needs a wider catchment model.
Use a standard framework, not identical settings.
The framework can require the same keyword categories, reporting metrics, quality checks, and review cycle. The actual keywords and grid geometry should reflect each market.
This balance creates consistency without forcing false uniformity.
Normalize Portfolio Metrics Without Hiding Local Variation
A rank of five in a dense urban market may represent stronger performance than a rank of two in a low-competition town.
Raw rankings should be reported at the location level. Portfolio summaries can add normalized measures such as market percentile, top-three coverage, median visibility, or performance against a local competitor set.
Do not use normalization to erase poor results.
Senior management should be able to see both views. The first shows how each location performs in its real market. The second helps compare branches fairly.
Flag locations with strong rankings but weak conversions. Also flag locations with weak average positions but strong lead production. Both cases require investigation.
Detect Cannibalization and Overlapping Google Business Profiles
Nearby branches can compete with each other.
A search may surface the wrong location. One branch may rank inside another branch’s target area. Practitioner profiles may outrank the main practice. Old or duplicate locations may continue to appear.
Grid scans can reveal these conflicts.
Track all related profiles on the same maps. Look for areas where the selected location changes repeatedly. Check whether customers are being directed to a less suitable branch.
Cannibalization is not always harmful. The brand may occupy several visible positions. The problem arises when the wrong profile receives calls, reviews, or directions, or when related profiles suppress each other.
Google Maps Ranking Checks for Service-Area Businesses
Service-area businesses travel to customers instead of receiving them at a public storefront.
Examples include plumbers, cleaners, locksmiths, electricians, mobile mechanics, and delivery-based services.
These businesses can hide their address and display a service area. That does not create equal ranking strength across every listed city or postal code.
A service area tells customers where the business operates. It should not be interpreted as a guaranteed ranking boundary.
Center the Grid on Operational Reality and Priority Demand Zones
A service-area business still has a verified base, even when the address is hidden from the public.
Tracking should be designed around commercial reality. The grid may begin near the verified base, but it should also examine the areas that produce valuable work.
Document the center point. Hidden-address businesses are especially vulnerable to unclear reporting because stakeholders cannot easily see why a particular point was chosen.
Do not center the grid on a city merely because the business wants to rank there. Confirm that the company serves the area efficiently and complies with profile guidelines.
Track Service Areas as Multiple Demand Clusters
One oversized grid can misrepresent a wide service territory.
Imagine a contractor serving three towns separated by rural land. A large square grid may contain dozens of low-value points between them. The average becomes a measure of empty geography.
Use several smaller grids around real demand clusters.
Each cluster can have its own keywords, customer value, competitor set, and conversion data. The business can then see where visibility aligns with operational capacity.
This approach is more useful than claiming broad coverage across an entire county or region.
Distinguish Geographic Limits From Optimization Problems
Poor visibility far from the verified base may reflect normal distance effects.
Poor visibility close to the base deserves closer review.
Check whether the profile is verified and eligible. Review the primary and secondary categories. Confirm that services match the query. Inspect the website and local landing pages. Look for duplicate profiles, incorrect map pins, or strong nearby competitors.
Do not promise a service-area business equal rankings across every listed area. A listed service area does not override distance.
How to Diagnose a Google Maps Ranking Drop
Ranking drops create pressure for immediate action. That is when measurement discipline matters most.
A decline can come from a real visibility loss. It can also come from a changed grid, a mismatched profile, a different search surface, or normal fluctuation.
Start with the data collection process before changing the profile or website.
Rule Out Measurement Errors Before Changing the SEO Strategy
Compare the current scan configuration with the baseline.
Check the exact keyword. Confirm the grid center, radius, dimensions, excluded points, language, device, time, and ranking depth.
Verify that the tool matched the correct profile. Businesses with similar names, moved locations, practitioner listings, or duplicate profiles can be confused.
Run manual checks at a small sample of weak points. If the tool and manual observations disagree sharply, investigate the collection method before drawing conclusions.
A measurement error can lead to unnecessary profile edits. Those edits may create a real problem where none existed.
Check Profile, Review, Category, Website, and Listing Changes
If the decline is real, inspect the change log.
A primary category edit can alter relevance. A move can change the proximity relationship across the market. Incorrect hours, a changed phone number, an updated website URL, or a new landing page can affect performance or conversions.
Review activity can also change competitive strength. A competitor may gain a significant number of recent reviews. Another may improve its rating or response activity.
Inspect the website. Pages may have been removed, redirected incorrectly, deindexed, rewritten, or weakened during a redesign.
Local performance is connected to the wider web presence. Do not limit the investigation to the profile dashboard.
Investigate Suspensions, Duplicates, Rebrands, Moves, Spam, and Algorithm Volatility
A disabled or suspended profile may stop appearing publicly. A duplicate can split signals or cause the wrong listing to surface.
Rebrands and moves create entity changes. Google must connect the old and new information correctly. Inconsistent citations, landing pages, directories, and customer references can slow that process.
Spam can also alter the competitive map. Keyword-stuffed names, fake locations, and duplicate profiles may enter the result set. Document suspected violations carefully. Use the appropriate reporting channels rather than launching public disputes.
If many businesses move at the same time, the cause may be broader than your campaign. Compare competitor grids and repeat the scan before reacting.
Turn Google Maps Ranking Data Into Specific Local SEO Actions
Ranking data becomes useful when it changes priorities.
A generic recommendation such as “optimize your profile” is not enough. The action should respond to the pattern, query group, competitor situation, and business objective.
Strong Near the Business but Weak Farther Away
A strong-center pattern suggests that Google understands the business but visibility decays with distance.
The first question is whether that decay is normal for the category.
Customers may only travel a short distance for coffee, convenience retail, or routine services. Trying to expand far beyond the natural catchment area may waste time.
For businesses with a wider realistic market, examine prominence. Earn relevant local links and mentions. Improve useful service pages. Build authority through associations, partnerships, sponsorships, events, and credible coverage.
Review acquisition can support trust and prominence, but do not reduce the strategy to review count. Relevance, authority, customer demand, and competitive distance still matter.
Weak Across Nearly the Entire Grid
A uniformly weak grid suggests a foundational issue.
Confirm that the profile appears for its own name. Check verification and policy status. Review the primary category and services. Inspect the map pin, business information, landing page, and website indexation.
Then compare the query with the actual business.
A general contractor may not be strongly relevant for every specialist repair term. A clinic may offer a treatment without having enough supporting information across its profile and website.
Fix core relevance before building large volumes of location content.
If the profile is new, allow time for systems to process and understand it. Keep information accurate and avoid repeated unnecessary edits.
Strong in Irregular Pockets but Weak in Priority Neighborhoods
Patchy visibility needs point-level investigation.
Check which competitors appear in weak neighborhoods. Study their categories, distance, reviews, websites, and local relevance. Look at the physical map. A river, highway, city boundary, or commercial center may shape the pattern.
Review customer language. Neighborhoods may use different terms for the same service. A citywide keyword may not reflect local phrasing.
Create useful location content only when the business genuinely serves the area and can add distinct information. Thin pages that swap place names do not solve weak relevance.
Test one change at a time when possible. Record the date. Keep the measurement configuration fixed.
Connect Local Search Visibility With Calls, Leads, Bookings, and Revenue
Rankings are an intermediate metric.
A business can improve its heatmap and still gain no meaningful customers. The keyword may have little demand. The profile may fail to persuade users. Calls may be missed. The landing page may convert poorly.
Ranking reports should sit beside customer-action data.
Combine Rank Data With Google Business Profile Performance
Business Profile Performance can show customer interactions such as calls, website clicks, directions, messages, and bookings when those metrics are available.
Compare those actions with ranking periods.
If top-three coverage rises for important keywords, do relevant interactions also increase? If the profile gains views but not calls, inspect the offer, photos, reviews, hours, services, and competitive presentation.
Search terms can also reveal whether the profile appears for relevant queries.
Do not treat every discovered term as a target. Some may be incidental, ambiguous, or unrelated. Focus on search themes that match the business and produce qualified engagement.
Use UTM Parameters, GA4, Call Tracking, and CRM Outcomes
Add consistent campaign parameters to the website URL used on the Business Profile. This helps analytics separate profile traffic from other organic visits.
Use a clear naming convention across locations. Do not create a different format for every branch.
Call tracking can help connect phone leads with local visibility. Use it in a way that keeps business information consistent and does not interfere with customer recognition or profile accuracy.
Analytics should record meaningful actions such as form submissions, appointment requests, purchases, and qualified calls.
The CRM closes the loop. It can show whether leads became appointments, contracts, or revenue.
Evaluate Incremental Business Impact, Not Just Correlation
Rankings and leads may rise at the same time without one fully causing the other.
Seasonality can increase demand. Advertising can create branded searches. A promotion can drive calls. A local event, weather incident, or competitor closure can shift customer behavior.
Use annotations. Record major campaign and business events beside ranking and conversion trends.
Look for geographic alignment. If visibility improves in three neighborhoods, do leads from those areas increase? If one keyword group improves, do inquiries for that service rise?
This does not create perfect attribution. It produces a stronger business case than a ranking screenshot alone.
How to Choose the Most Accurate Google Maps Rank Checker
There is no universally best tool.
The right choice depends on whether you manage one business, an agency portfolio, a franchise network, or a service-area operation. It also depends on how often you scan, how deep you need to track, and how the data will be reported.
Ignore unsupported claims of perfect accuracy.
A third-party tool is measuring or simulating local results. Its output can differ from another tool because the configuration, collection process, timing, matching logic, and metric formulas differ.
Essential Geo-Grid and Local Rank Tracker Features
A useful platform should let you control the center point, radius, grid density, language, device, ranking depth, and scan schedule.
It should preserve the configuration so later scans use the same settings.
The system should identify the target profile accurately. Persistent location identifiers are safer than relying only on a business name, which can change or match another listing.
Historical comparisons should show both the map and summary metrics. Competitor overlays, exports, annotations, and excluded-point controls improve analysis.
A legacy search for a Google My Business ranking checker may still surface relevant tools, but the current product name is Google Business Profile. The tool should support current profile structures and reporting needs rather than relying on outdated terminology.
Reporting, Multi-Location, Integrations, and Governance Features
Agencies and multi-location businesses need more than scanning.
Look for grouped locations, account permissions, white-label reports, bulk setup, scheduled exports, data retention, and API access where required.
Governance features matter. Teams should know who changed a keyword, grid, competitor, or schedule. Without a change log, reporting inconsistencies can go unnoticed.
Check whether the platform separates Maps, local packs, and organic rankings. A single blended score can hide important movement.
The reporting interface should make weak performance visible. A tool that encourages selective screenshots is not helping the measurement process.
Free vs Paid Google Maps Ranking Checkers
A free checker is enough for a one-time audit, spot validation, or early investigation.
A paid tool becomes useful when you need recurring scans, historical comparisons, several keywords, larger grids, competitor tracking, portfolio management, or scheduled reporting.
Review the credit model carefully. A 7-by-7 grid uses 49 search points for one keyword. Ten keywords across ten locations can consume thousands of point checks in one reporting cycle.
Calculate the real monthly usage before choosing a plan.
Price should be compared with the decisions the data supports. Cheap tracking that produces inconsistent or unusable reports has little value.
Build a Google Maps Ranking Report Stakeholders Can Trust
A good report allows someone else to understand what was measured, what changed, and what decision follows.
It should not hide the methodology behind a single color score.
The report should lead with business relevance. Show priority keyword groups, target zones, competitive position, and customer outcomes.
Report Configuration Before Reporting Results
Begin with the measurement specification.
State the target profile, keywords, search surface, grid, radius, dates, device, language, timing, ranking depth, and excluded points.
Explain any change from the previous period. If the grid was expanded, show the old and new results separately. Do not present the difference as pure ranking movement.
Include the baseline period. A percentage change without a stable baseline can mislead stakeholders.
Transparent configuration builds trust and makes the work auditable.
Show Maps, Local Pack, and Organic Visibility Separately
A business can gain Maps visibility while losing organic traffic.
Another may improve its website rankings without moving in the local pack.
Report these surfaces separately. Then explain how they work together.
Maps reporting should include geographic coverage. Local pack reporting should show whether the profile enters the visible three-result group. Organic reporting should use website search data and landing-page performance.
This structure prevents a broad “SEO improved” statement when only one channel moved.
Add Change Annotations and Decision Thresholds
Annotate profile edits, category changes, website launches, review campaigns, relocations, suspensions, major competitor changes, and known search volatility.
Set decision thresholds before looking at the result.
For example, the team might investigate when top-three coverage drops by a defined amount across two consecutive weekly scans. A one-day movement would not trigger a major strategy change.
Thresholds should account for normal volatility. Competitive emergency terms may move more than stable branded terms.
The report should end with a decision, owner, and next measurement date.
Google Maps Rank-Tracking Quality Assurance Checklist
Quality assurance protects the campaign from false conclusions.
It should be completed before scanning, immediately after scanning, and before trend reporting.
Pre-Scan QA
Before the scan:
- Confirm the correct profile, exact keywords, keyword groups, search surface, device, language, grid center, radius, dimensions, excluded points, schedule, and ranking depth.
- Check that the grid represents real customer demand and that no weak point has been removed only to improve the score.
- Review the change log and note profile, website, competitor, operational, or campaign events that could affect interpretation.
Post-Scan QA
After the scan:
- Check for missing points, mismatched profiles, impossible jumps, duplicate listings, unusual competitors, and results that conflict with recent scans.
- Manually verify a small sample of strong, weak, and unexpected points.
- Confirm that exports, labels, dates, and comparison periods are correct before the data reaches a client or manager.
Trend QA
A trend is valid only when the compared scans are compatible.
Confirm that the keyword, grid, radius, point selection, device, language, surface, timing, and ranking depth remained consistent.
Check whether movement persists across repeated scans. Compare the pattern with competitor changes and customer actions.
Do not call a change successful because the map became greener. Confirm that important keywords improved in relevant areas and that the business received useful exposure.
Frequently Asked Questions About Google Maps Ranking Checks
How Often Should Google Maps Rankings Be Checked?
Weekly scanning works well for many active campaigns. It balances timely feedback with manageable noise.
Monthly checks may suit stable businesses with limited changes. Daily scans are better reserved for short-term investigations, migrations, suspension recovery, competitive incidents, or carefully controlled tests.
The most important factor is consistency. Use the same schedule and settings. Run additional scans before and after major changes, but keep them separate from the standard trend when timing differs.
Can a Business Have One Official Google Maps Rank?
No.
A business can have a position for a defined keyword, location, time, device, and search surface. It does not have one universal citywide rank.
A single manual search is one observation. A grid provides a sample of several observations. Historical tracking shows how that distribution changes.
Report visibility as coverage and geographic pattern. Avoid claims such as “we rank number one in the city” unless the statement is carefully limited to the measured locations and queries.
Why Do Two Google Maps Rank Trackers Show Different Results?
Two tools may use different coordinates, scan times, search environments, device settings, ranking depths, profile-matching systems, or formulas.
One tool may count a missing result as position 21. Another may exclude it from the average. One may track Maps results. Another may track the local pack.
Compare the configuration before comparing the score.
Run both tools using the same keyword, grid, radius, timing, language, device, and ranking depth. Manually validate several points.
Small differences are normal. Large differences require investigation.
A Better Standard for Measuring Local Rankings
Accurate tracking begins when you stop asking, “What rank are we?”
Ask better questions.
Where does the profile appear? Which queries trigger it? How quickly does visibility decline with distance? Which competitors displace it? Which neighborhoods matter commercially? Did the same settings produce the comparison? Did improved visibility create more qualified customer actions?
A reliable process has five parts.
First, define the business objective and keyword groups. Second, map the real customer area. Third, run controlled searches across fixed points. Fourth, interpret patterns alongside competitors and profile changes. Fifth, connect the rankings with calls, bookings, leads, and revenue.
This turns a ranking tool into a measurement system.
The final principle is simple:
A business does not have one Google Maps rank. It has a changing distribution of positions across locations, queries, devices, and time.
Track that distribution consistently. Keep the raw data visible. Explain the limitations. Measure the business effect.
That is how a Google Maps ranking check becomes accurate, useful, and worth acting on.