

Small businesses have access to more SEO data than ever. Google Search Console can report impressions, clicks, queries, pages, devices, countries, and search appearances. Google Analytics can track sessions, key events, revenue, and acquisition channels. SEO platforms can add rankings, backlinks, visibility scores, local results, competitor data, and AI search signals.
That abundance creates a problem. Having more SEO metrics does not make it easier to know whether SEO is working.
A business owner may receive a report showing a 30% increase in impressions, 75 new keyword rankings, a higher authority score, and thousands of additional organic sessions. None of those numbers answers the most important question: Did organic search create more qualified opportunities and profitable customers?
The best SEO KPIs for small business connect what happens in search results to what happens in the business. They show whether potential customers can find you, whether the right people visit, whether they take meaningful actions, and whether those actions ultimately create revenue.
That means a useful measurement system follows a chain:
Search visibility → clicks → qualified visits → conversions → qualified leads → customers → revenue → return on investment
The further a KPI sits to the right of that chain, the closer it is to actual business performance. The metrics on the left still matter because they help diagnose why revenue is moving, but they should not automatically receive equal weight.
This distinction has become more important as search behavior changes. In a February 2026 study using 300,000 keywords and aggregated Google Search Console data, Ahrefs found that the presence of an AI Overview correlated with a roughly 58% lower click-through rate for the top-ranking page compared with the expected CTR without an AI Overview. The study focused on informational queries, so the percentage should not be applied blindly to every industry or search, but it demonstrates why rankings and traffic can no longer tell the entire story.
A small business therefore needs a measurement framework that is simple enough to use every month, but detailed enough to reveal what is happening when results change.
| Business question | Primary KPI | What it tells you |
|---|---|---|
| Are new prospects discovering us? | Non-branded search visibility | Whether SEO reaches people who did not already know the brand |
| Are searchers choosing our result? | Organic CTR and clicks | Whether visibility becomes website traffic |
| Are visitors taking meaningful action? | Organic conversion rate | Whether organic visitors turn into inquiries, bookings, or purchases |
| Are those inquiries valuable? | Qualified organic leads | Whether SEO reaches the right potential customers |
| Is SEO producing business growth? | Revenue and SEO ROI | Whether the investment generates financial value |
| Is local search producing demand? | Calls, bookings, directions, local leads | Whether Google Search and Maps generate real-world actions |
What Are SEO KPIs, and Why Do They Matter for a Small Business?
An SEO key performance indicator is a measurement tied to a defined business or marketing objective. A metric tells you what happened. A KPI tells you whether you are making progress toward something that matters.
If a roofing company wants more residential replacement projects, total pageviews are a metric. Qualified estimate requests from organic search are a KPI because they measure progress toward the business goal.
SEO KPI vs. SEO metric: the difference that matters
Every KPI is a metric, but not every SEO metric deserves KPI status.
Consider backlinks. A site may acquire 40 new backlinks in a month, yet most could come from irrelevant directories or low-value pages. The number changed, but the business outcome may not.
The same issue applies to keyword counts. Ranking for 2,000 phrases sounds better than ranking for 800, but the larger total can be less valuable if most additional queries have no connection to products, services, or buyer intent.
Useful SEO performance metrics become KPIs when three conditions are met. They connect to a goal, they are measured consistently, and a change in the number can influence a decision.
If a metric changes and nobody knows what decision it should trigger, it probably does not belong on the owner’s dashboard.
How SEO measurement connects visibility to revenue
Search performance should be evaluated as a system rather than a collection of unrelated numbers.
A page first needs to be crawlable and indexable. It then needs enough relevance and authority to appear for useful searches. Searchers need to notice and choose the result, and the page must persuade the right visitors to take an action.
The process does not stop at a form submission. For many small businesses, the lead must still be qualified, contacted, quoted, and closed before SEO produces revenue.
This is why how to measure SEO success depends partly on the company’s sales model.
An ecommerce store may connect organic visits to purchases in one analytics environment. A commercial contractor may receive phone calls, estimate forms, referrals, and repeat visits over several weeks before a deal closes.
A B2B consulting company might attract someone through an educational article, lose attribution when the person returns directly two weeks later, then receive a sales inquiry after a branded Google search.
The shorter the customer journey, the easier SEO attribution becomes. The longer the journey, the more important CRM and assisted-conversion data become.
Leading vs. lagging SEO indicators
Understanding leading vs lagging SEO indicators prevents premature conclusions.
Leading indicators move before revenue. They include search impressions, non-branded visibility, relevant keyword rankings, organic click-through rate, and traffic to commercially important pages.
Lagging indicators appear later. They include qualified leads, closed customers, revenue, customer acquisition cost, and SEO ROI.
Suppose a dental practice publishes a new service page. Search Console impressions may begin growing before clicks become meaningful. Clicks may then rise before appointment requests, and appointments may take additional time to become booked treatments.
Judging the page only by revenue during the first weeks can hide genuine progress. Judging it indefinitely by impressions can hide failure.
The correct question changes with the stage of the campaign. Early on, ask whether Google is discovering and showing the right pages. Later, ask whether that visibility creates qualified demand.
The minimum viable KPI set
Most small businesses do not need 25 numbers on a monthly dashboard.
A useful starting point is five to seven headline KPIs covering discovery, acquisition, conversion, quality, and financial impact. Supporting metrics remain available for diagnosis when something changes.
For a service company, that core set could be non-branded clicks, commercial landing-page traffic, qualified organic leads, organic conversion rate, new organic customers, revenue from organic search, and organic customer acquisition cost.
The exact selection should change according to the business model. The goal is not to build the most complete dashboard. The goal is to build the smallest dashboard that reliably supports decisions.
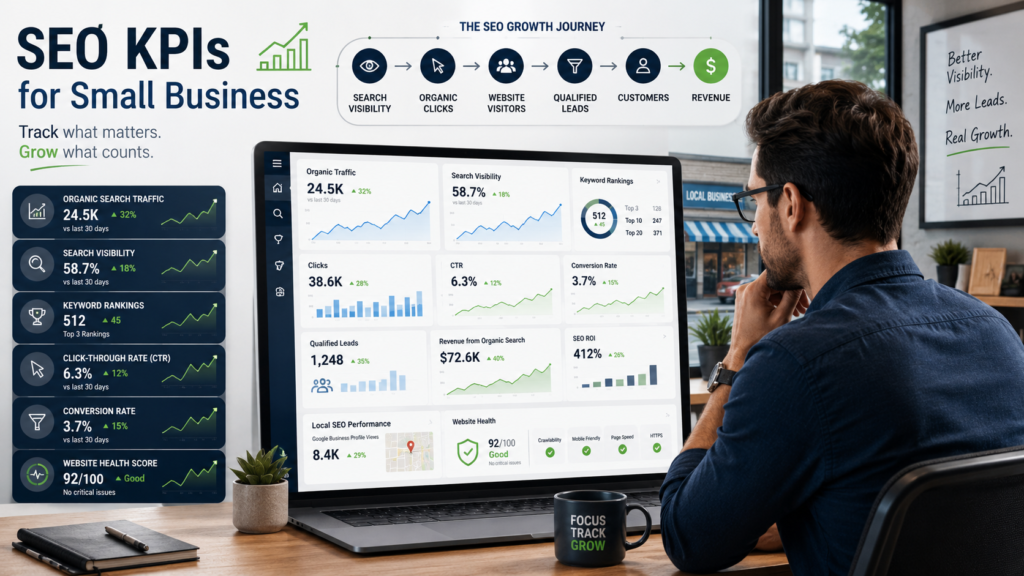
The SEO KPIs Most Small Businesses Should Track
Individual businesses need different scorecards, but several KPI groups apply across most websites.
The key is to understand what each group can and cannot prove.
Search visibility, keyword rankings, and non-branded discovery
Search visibility measures how present your site is across the searches that matter to the business.
This is more useful than celebrating one number-one ranking because customers rarely search with one exact phrase. They use service terms, problems, questions, locations, comparisons, brands, product categories, and variations Google considers semantically related.
Keyword rankings remain valuable as diagnostic indicators. If an important service page falls from position three to position 18 for several closely related terms, the change deserves investigation.
Rankings become misleading when they are treated as the final goal. Ranking first for a query nobody valuable searches for creates no meaningful business advantage.
A stronger measurement approach also separates branded vs non-branded traffic.
Branded searches include the company name and closely associated products or services. These searches often represent people who already know the business through referrals, ads, previous visits, offline marketing, or word of mouth.
Non-branded searches include phrases such as “commercial roofing company,” “estate planning attorney near me,” or “inventory management software for small business.” Winning these searches shows whether SEO is reaching prospects before they have chosen a provider.
Google made this analysis easier by introducing a branded queries filter in Search Console. Google announced in March 2026 that the filter was available to all eligible sites, automatically distinguishing branded and non-branded queries where the feature can classify them.
For most growth-focused companies, non-branded traffic and visibility deserve more attention than total organic traffic alone.
A brand can experience rising total organic traffic because existing customers increasingly search its name. That may be good for the company, but it does not necessarily mean SEO is expanding market reach.
Organic clicks, organic traffic, and click-through rate
Organic search traffic measures visits generated from unpaid search results. It is useful because a website normally needs visitors before it can generate online conversions.
Google Search Console and Google Analytics view this traffic from different points in the journey.
Search Console measures search activity before the visitor arrives on the site. Its Performance data includes clicks, impressions, average CTR, and average position. Google Analytics focuses on what happens once users interact with the website.
The numbers should not be expected to match perfectly.
Google explicitly notes that Search Console clicks and Analytics sessions are calculated differently and will normally show some discrepancy. The more important test is whether the overall trends make sense together.
Organic click-through rate, often shortened to organic CTR, adds another layer.
CTR is clicks divided by impressions. If a page receives 10,000 impressions and 400 clicks, its CTR is 4%.
A falling CTR is not automatically an SEO failure.
The page may have gained visibility for broader queries where it ranks lower. A local pack, shopping result, featured snippet, or AI Overview may also take attention from traditional organic listings.
This is why CTR should usually be reviewed by query, page, device, search intent, and average position, rather than as one website-wide percentage.
Consider two pages.
Page A ranks first for a low-volume branded query and earns a 30% CTR. Page B ranks fourth for a high-value commercial query, earns a 6% CTR, and produces eight qualified leads per month.
Page A looks stronger if CTR is the only metric. Page B is more valuable to the business.
Organic conversions, conversion rate, and qualified leads
Traffic becomes commercially meaningful when visitors do something valuable.
Examples include purchasing a product, requesting a quote, scheduling an appointment, starting a trial, calling the business, submitting a contact form, or booking a consultation.
Organic conversions count these actions. Organic conversion rate measures the percentage of relevant organic visits or users that produce the chosen action.
The formula is straightforward:
Organic conversion rate = organic conversions ÷ organic visits × 100
The difficult part is deciding what should count as a conversion.
A form submission is not necessarily a qualified opportunity. Spam, job seekers, vendors, students, people outside the service area, and prospects with impossible budgets can all complete forms.
That is why lead-generation businesses should add qualified organic leads to the scorecard.
A qualified lead meets criteria that make a sale realistically possible. Those criteria may include location, company size, service need, budget, timing, or decision-making authority.
Imagine a law firm that receives 100 organic inquiries in April and 90 in May. At first glance, performance declined by 10%.
Now suppose April produced 20 qualified cases while May produced 32. Lead volume fell, but commercially useful organic demand increased by 60%.
A traffic or form-submission report would miss that improvement entirely.
Revenue, CAC, customer value, and SEO ROI
The most important financial KPI is usually revenue from organic search, although attribution can become complex for businesses with long buying cycles.
Ecommerce companies can often connect transactions and purchase revenue directly to sessions and acquisition channels. Service companies usually need CRM data, call tracking, or manual lead-source reconciliation to connect inquiries to closed sales.
Once customer data is available, calculate customer acquisition cost for organic search.
A practical formula is:
Organic CAC = total SEO investment ÷ new customers attributed to organic search
SEO investment should include the costs that genuinely support the program. Depending on the company, that can include agency fees, internal labor, content production, development, tools, digital PR, and other direct expenses.
For lead-generation businesses, cost per organic lead can provide an earlier signal:
Cost per organic lead = SEO investment ÷ qualified organic leads
Use qualified leads rather than raw forms whenever possible. Otherwise, an increase in junk inquiries can artificially make acquisition look more efficient.
Customer lifetime value adds another dimension.
If organic search consistently generates customers worth $8,000 over their relationship with the company while another channel brings customers worth $2,000, comparing acquisition cost without lifetime value can lead to poor budget decisions.
Finally, calculate SEO ROI when attribution and cost data are reliable enough.
A simple version is:
SEO ROI = (profit attributable to SEO − SEO investment) ÷ SEO investment × 100
Revenue and profit should not be confused. A retailer with $100,000 in organic revenue and a 25% gross margin has a very different return profile from a software company with the same revenue.
SEO ROI also has timing limitations. Content published today can generate traffic for years, while the cost may be recorded entirely in the month it was created.
For strategic decisions, evaluate SEO economics across a long enough period to capture both the cost and the value created by the work.
SEO KPIs by Small-Business Type
The phrase “small business” includes companies with radically different customer journeys.
A local plumber, an ecommerce store, a B2B software firm, and a new online publisher should not use identical KPI scorecards.
Local service businesses
Local service businesses should prioritize actions that indicate real service demand.
For a plumber, electrician, dentist, attorney, HVAC contractor, landscaper, or medical practice, the most valuable search activity may never begin with a traditional website session.
A prospect may find the business in Google Maps, read reviews, tap the phone button, and call. Another person may request directions or book directly from the Business Profile.
A local scorecard should therefore emphasize qualified calls, booked appointments, estimate requests, local landing-page conversions, map interactions, and closed revenue.
Rankings still matter, but use them to explain changes in demand rather than as the final definition of success.
An improvement from position seven to position two for a service-plus-city query matters because it can produce more qualified discovery. The business outcome is still the appointment, call, quote, or sale.
Ecommerce businesses
Ecommerce SEO sits closer to transaction data, which makes financial measurement easier.
Useful KPIs include non-branded category traffic, organic product-page traffic, transactions, organic conversion rate, average order value, revenue, new customer acquisition cost, and customer lifetime value.
The distinction between page types matters.
A 50% increase in blog traffic can coincide with falling category-page traffic. Looking only at website-wide organic traffic could make the month appear successful even while commercially valuable search visibility is deteriorating.
Ecommerce companies should segment organic performance by page purpose.
Informational pages create awareness and assist discovery. Category and product pages capture stronger buying intent. Both are valuable, but their jobs differ.
A useful ecommerce question is not simply, “Did organic sessions increase?”
Ask, “Which landing pages produced the revenue increase, and did we acquire new customers profitably?”
B2B and professional-service businesses
B2B SEO often has a long sales cycle.
A decision-maker might read an article in February, return through a comparison page in March, subscribe to a newsletter, search the brand in April, attend a webinar, and request a consultation in May.
Last-click reporting may credit only the final visit.
Google Analytics supports both data-driven attribution and paid-and-organic last click for eligible event-scoped reporting. Google’s data-driven attribution distributes credit according to observed contribution across touchpoints rather than assigning all credit to the final interaction.
Small B2B firms should therefore look beyond form fills.
Track qualified leads, meetings, opportunities, pipeline, closed customers, revenue, and assisted organic influence where your analytics and CRM data allow it.
An SEO program can generate fewer leads while creating more pipeline if it shifts toward higher-value searches.
For a consulting company, five conversations with ideal enterprise buyers may matter more than 50 inquiries from microbusinesses that cannot afford the service.
Content-led and early-stage businesses
An early-stage website may not have enough traffic or conversions to evaluate monthly SEO revenue intelligently.
That does not mean measurement should stop. It means the KPI hierarchy should reflect the maturity of the program.
Early indicators can include indexation of target pages, relevant non-branded impressions, improving search visibility, first-page rankings, qualified organic clicks, and initial conversions.
As traffic matures, move the scorecard closer to qualified leads and revenue.
Your SEO KPIs should evolve as the website evolves.
A six-month-old site and a six-year-old site do not need the same reporting framework.
Local SEO KPIs: What Local Businesses Should Measure
Local SEO KPIs deserve their own measurement layer because Google Search and Maps can create customer actions without a conventional organic website visit.
For many small businesses, overlooking these interactions means undercounting search’s contribution.
Google Business Profile metrics that indicate intent
Current Google Business Profile metrics can include profile views and actions such as calls, website clicks, direction requests, messages, and bookings where the relevant features are available.
Google defines calls as clicks on the call button, directions as direction requests, and website clicks as clicks from the Business Profile to the website.
These metrics do not all carry equal commercial value.
A profile view shows visibility. A direction request suggests stronger intent. A completed booking sits much closer to revenue.
Measure them as a funnel rather than placing them in one bucket.
Google has also introduced the ability to connect Business Profile data with Google Analytics, allowing metrics such as calls, website clicks, directions, messages, bookings, and other eligible interactions to be viewed alongside broader website data.
That connection can make local reporting easier, especially for companies managing several locations.
Local rankings and map visibility
Local ranking reports need geographic context.
A business may rank first when checked from its office and sixth from a neighborhood four miles away. One manually searched position cannot represent an entire service area.
For location-dependent businesses, track map visibility across the neighborhoods or ZIP codes that contain valuable customers.
Also distinguish local organic landing pages from map results.
A company might lose traditional organic visibility while improving map visibility, or the reverse. Looking at both prevents false conclusions.
Search personalization and geographic proximity mean local ranking data should be treated as a directional measure rather than an absolute truth.
The goal is not to own one map screenshot. The goal is to increase qualified local demand across the market you serve.
Leads and revenue by location
Multi-location businesses should avoid combining every market into one total.
Suppose a dental group has locations in Dallas, Plano, and Frisco. Total organic leads rise 12%.
The combined number looks positive, but it could hide a 40% decline in Plano that is being offset by strong Dallas growth.
Reporting by location can reveal problems with local pages, reviews, competition, tracking, or Google Business Profile visibility before they become larger revenue issues.
Where possible, connect the chain:
Location visibility → local interactions → qualified leads → appointments → customers → revenue
Local metrics that often create noise
Raw profile views can be useful, but they should rarely be celebrated without downstream actions.
Review count also requires context. Reviews influence trust and local search behavior, but adding 20 reviews does not automatically mean the business generated 20 additional customers.
Likewise, a single map ranking can change with the searcher’s physical location.
A practical local dashboard gives greater weight to calls, bookings, qualified inquiries, direction requests for relevant business types, and closed revenue than to raw exposure numbers.
Technical and Authority Metrics: Important Signals, but Usually Not Business KPIs
Technical SEO data matters because poor technical health can prevent good content from performing.
The mistake is putting technical metrics at the same level as revenue on an owner’s scorecard.
Indexed pages and indexation of important URLs
The number of indexed pages sounds straightforward, but more is not always better.
A site with 10,000 indexed URLs is not automatically stronger than a site with 500. Thousands of duplicate, thin, filtered, outdated, or low-value pages can create technical problems rather than search growth.
A more useful question is:
Are the pages we expect to generate visibility and business value eligible for and present in Google’s index?
If the company’s three highest-margin service pages disappear from the index, that is urgent.
If Google declines to index 200 internal search-result URLs that were never intended for search, that may be perfectly healthy.
Track indexation against intentional page types, not against the fantasy that every URL should appear in Google.
Core Web Vitals and website experience
Google’s Core Web Vitals currently focus on Largest Contentful Paint, Interaction to Next Paint, and Cumulative Layout Shift.
Google’s guidance defines “good” performance as LCP within 2.5 seconds, INP below 200 milliseconds, and CLS below 0.1, evaluated using real-user experience at the 75th percentile where sufficient data exists.
These numbers are valuable for technical diagnosis and user experience.
They should not be treated as a promise that improving a score from 91 to 98 will directly produce a specific ranking or revenue increase.
Google explicitly advises site owners not to focus on only one or two page-experience factors, but to evaluate the overall experience.
For a small business, Core Web Vitals become strategically important when performance problems are severe enough to frustrate visitors, interfere with conversions, or signal broader technical quality issues.
A slow booking page that costs appointments matters more than winning a perfect lab score on an obscure article.
Referring domains and backlink quality
Links remain useful for evaluating a site’s authority and competitive position, but total backlink counts are easy to misread.
Ten links from respected, relevant organizations can carry more strategic value than 500 links from unrelated low-quality domains.
Track referring domains with context.
Ask whether links come from credible sites, whether the referring pages are relevant, whether important commercial or informational assets are earning authority, and whether competitors consistently attract links your site lacks.
Link metrics are especially useful when diagnosing why strong pages struggle to compete in difficult results.
They become vanity metrics when the goal changes from earning meaningful authority to making the backlink number go up.
Domain scores and site-health scores
Third-party metrics such as Domain Rating, Domain Authority, Authority Score, and generic site-health percentages can help with comparison and prioritization.
They are not Google metrics, and they do not directly report customers or revenue.
Ahrefs itself distinguishes Domain Rating and website health scores from more meaningful business KPIs, recommending that marketers understand their diagnostic role rather than elevate them into business outcomes.
If your authority score increases while commercial rankings, qualified traffic, and leads decline, the authority score does not rescue the campaign.
Use third-party scores to investigate. Do not use them to declare victory.
How AI Overviews and Zero-Click Search Change SEO Measurement
Search measurement used to follow a relatively simple assumption.
If rankings improved, clicks should generally improve. If clicks improved, website traffic should generally improve.
That relationship still exists, but it is less predictable.
Why clicks alone no longer tell the whole story
Search results now contain maps, videos, products, featured snippets, knowledge panels, People Also Ask results, AI Overviews, and other features that can answer questions before a visit occurs.
This matters most for informational searches.
Ahrefs’ December 2025 dataset found that the top-ranking page for keywords with AI Overviews experienced substantially lower average CTR than the expected CTR calculated from comparable informational queries without AI Overviews. The analysis used 150,000 AI Overview keywords and 150,000 informational keywords without an AI Overview.
This does not mean organic clicks are obsolete.
A phone call, purchase, form submission, demo request, or booked consultation generally still requires some form of interaction with the business.
What has changed is the assumption that every unit of increased visibility should create the same number of clicks it did several years ago.
Small businesses should look at the relationship between impressions, search features, branded demand, clicks, conversions, and revenue.
AI search visibility and brand mentions
AI search visibility describes how frequently and prominently a company appears in generated answers across platforms such as Google AI experiences, ChatGPT, Gemini, or Perplexity.
For some businesses, this can become a useful discovery metric.
It is still an immature measurement category.
Platforms differ in how they generate answers, citations can change frequently, logged-in experiences may differ, and there is no universal equivalent of Search Console covering every generative engine.
That means AI visibility belongs in the supporting layer of most small-business dashboards.
If a brand gains 500 AI mentions but generates no measurable awareness, qualified traffic, leads, or sales, the metric should not be assigned an imaginary dollar value.
AI citations vs. referral traffic
AI citations are also different from AI referral traffic.
A brand may be mentioned without a clickable citation. A page may be cited but never clicked. A user may learn about the brand through an AI answer and later search for the company directly.
This creates attribution challenges.
One useful approach is to monitor AI citations alongside referral traffic from identifiable AI platforms and changes in branded search demand.
If citations rise, direct AI referrals rise, branded searches rise, and qualified conversions rise during the same period, you have a stronger body of evidence than any metric provides alone.
Still, correlation is not proof of exact causation.
Be transparent about that uncertainty.
What a small business should prioritize
For most small businesses, AI metrics should not replace traditional commercial KPIs.
The hierarchy should remain:
Customers and revenue first. Qualified conversions second. Commercial search visibility and clicks third. AI visibility as supporting evidence.
That structure keeps the company focused on economic outcomes while allowing the measurement framework to evolve with search behavior.
How to Track SEO KPIs With Google and Third-Party Tools
The ideal small-business stack is usually simpler than agencies make it look.
Google Search Console and Google Analytics provide enough data to answer many important questions. Local businesses can add Business Profile performance, while CRM, ecommerce, call-tracking, and SEO tools close specific gaps.
Google Search Console: what happens before the click
Google Search Console is the primary source for understanding how a site appears in Google Search.
Its Performance reporting centers on clicks, impressions, CTR, and average position, which can be segmented by dimensions such as query, page, country, device, and search appearance.
Do not treat average position as a precise rank tracker.
It is an average across search appearances and circumstances. A query may appear in different positions by device, location, user, date, and search-result configuration.
Search Console is most powerful when metrics are interpreted together.
If impressions increase while average position remains similar, search demand may be rising or Google may be showing the page for additional queries.
If position improves but CTR falls, investigate SERP features, intent alignment, device mix, title presentation, and the specific queries generating impressions.
If clicks rise while conversions fall, Search Console may be doing its job perfectly. The problem could be landing-page intent, website experience, lead quality, or conversion tracking.
FiveUp’s detailed Google Search Console Performance Report guide can be used for deeper query, page, CTR, branded, non-branded, and trend analysis rather than turning this KPI article into a Search Console tutorial.
There is also an important 2026 data-quality lesson.
Google reported and later resolved a Search Console logging issue that affected impression reporting from May 13, 2025 through April 27, 2026. Google said clicks were not affected, but impressions and related CTR and average-position data were.
That is a useful reminder that measurement systems themselves can change or contain anomalies.
When a graph behaves strangely, investigate the platform before rewriting the entire SEO strategy.
GA4: what happens after the visit
Google Analytics 4 helps answer a different set of questions.
Its Traffic acquisition reporting can identify sessions associated with channels such as Organic Search, while events and key events can measure actions visitors take after arriving.
Configure meaningful actions rather than relying on default engagement data.
For a service company, that may mean completed forms, booked consultations, qualified phone calls, or application starts.
For ecommerce, purchases and revenue are more direct.
GA4 also requires interpretation.
An engaged session can be useful diagnostically, but a visitor spending three minutes reading an article is not automatically more valuable than someone who spends 40 seconds on a service page and calls.
Engagement metrics describe behavior. Business KPIs describe value.
Business Profile, CRM, and call tracking
A website analytics platform can only report what it can observe.
If half your customers call after finding you in Maps, GA4 website sessions alone will understate local search’s value.
If sales representatives close leads offline without updating their CRM source data, SEO’s impact will remain partly invisible.
A serious lead-generation measurement system should connect search data to CRM outcomes where practical.
Record whether inquiries are qualified. Track which opportunities become customers. Store deal value or expected revenue when appropriate.
Call tracking can help local businesses distinguish organic calls from other sources, although implementation must be handled carefully to preserve consistent business information and accurate attribution.
The goal is not perfect surveillance of every customer journey.
The goal is enough reliable data to make better decisions than you could make from traffic alone.
When Ahrefs, Semrush, and rank trackers help
Paid SEO platforms become useful when the questions go beyond Google’s first-party data.
They can help track competitor visibility, keyword groups, local positions, backlinks, content gaps, SERP features, and emerging AI visibility.
Choose tools based on decisions, not feature count.
A five-location service company may benefit from local grid tracking. An ecommerce company with 50,000 products may need advanced crawling and keyword segmentation. A ten-page consulting website may not.
Software should reduce uncertainty. It should not create 40 additional charts nobody uses.
How to Build a Simple Small-Business SEO Dashboard
A strong SEO dashboard has layers.
The owner sees a handful of business outcomes. The marketing team sees enough search and conversion data to explain those outcomes. Technical specialists can access deeper diagnostics when something requires investigation.
Executive layer: the numbers the owner should see
The owner’s view should focus on business performance.
For many lead-generation companies, that means qualified organic leads, new customers, attributed or influenced revenue, organic CAC, and a simple trend indicator for high-intent search visibility.
For ecommerce, replace lead metrics with transactions, new customers, revenue, and customer economics.
Do not make an owner interpret crawl errors, individual keyword movements, or page-speed distributions to understand whether marketing is working.
An SEO report should behave like an instrument panel, not a trophy cabinet.
A useful instrument panel tells you whether you are moving toward the destination, whether something is wrong, and where to investigate.
Performance layer: what the marketer should watch
The marketer needs more context than the owner.
This layer can include non-branded clicks, organic traffic to priority page groups, organic conversion rate, search visibility, CTR, top commercial landing pages, local interactions, and lead quality.
Segmenting by intent often reveals more than website totals.
Traffic to educational content may rise 50% while service-page clicks fall 15%.
The site-wide graph looks excellent. The commercial trend deserves concern.
Traffic can rise while commercial visibility falls because informational growth can hide weakness on the pages that pay the bills.
Diagnostic layer: metrics to open when something changes
Technical and granular data belong here.
If organic revenue falls, investigate whether qualified leads declined first.
If qualified leads declined, check commercial page conversions and traffic.
If commercial traffic declined, inspect Search Console clicks, impressions, positions, indexation, SERP changes, competitors, and technical health.
This is a much more effective sequence than opening a 70-point SEO audit every Monday.
Diagnosis should move backward through the funnel until you find where performance changed.
Avoid dashboard overload
Small-business dashboards tend to grow over time.
Someone asks for a backlink chart. Someone else asks for top 100 keywords. Another stakeholder wants engagement rate, authority score, crawl health, device mix, and 15 individual location graphs.
Soon the report takes 45 minutes to read and no longer produces decisions.
The best small-business SEO dashboard is deliberately incomplete.
It contains the metrics needed for regular management, while detailed information remains available on demand.
How to Interpret SEO KPI Patterns and Decide What to Fix
Tracking numbers is the easy part.
The real SEO skill is recognizing combinations of metrics and translating them into useful hypotheses.
| Pattern | Likely questions | Best first action |
|---|---|---|
| Impressions rise, clicks stay flat | Did CTR, intent, position, or the SERP change? | Segment GSC queries and pages |
| Traffic rises, leads stay flat | Is new traffic low-intent or poorly converting? | Compare landing pages and conversion rates |
| Leads rise, sales stay flat | Did lead quality or sales follow-up change? | Review CRM qualification and close rates |
| Rankings rise, revenue stays flat | Are the ranking queries commercially valuable? | Audit keyword intent and landing-page value |
| Organic revenue falls suddenly | Tracking issue, demand change, ranking loss, or conversion problem? | Validate analytics before diagnosing SEO |
| Local views rise, calls fall | Are searchers seeing the right profile and offer? | Review GBP actions, queries, reviews, and landing experience |
Impressions rise, but clicks stay flat
This pattern often causes unnecessary concern.
First check whether the additional impressions come from relevant queries.
A page ranking fourth for one commercial phrase might begin appearing in positions 20 to 50 for dozens of related informational queries. Impressions increase sharply, but clicks barely move because the new visibility occurs too far down the results.
That can represent progress, not failure.
The opposite can also happen.
Average position improves for a query while CTR drops because an AI Overview, map pack, video carousel, or other SERP element changes user behavior.
Check page and query-level data before rewriting titles simply because the website-wide CTR decreased.
Organic traffic rises, but leads stay flat
This pattern usually means one of three things.
The site attracted more informational visitors, the new visitors were less qualified, or conversion performance weakened.
Start by segmenting landing pages.
If traffic grew mainly through articles such as “what is commercial insurance?” while service-page visits remained flat, the lead result may be perfectly understandable.
Then examine whether informational traffic assists later conversions.
If it does not, consider improving internal links, commercial next steps, topic selection, or audience targeting.
If service-page traffic increased but leads did not, investigate conversion rate, forms, mobile experience, page messaging, calls to action, trust signals, pricing expectations, and technical problems.
Do not assume every traffic problem is an SEO problem. Sometimes SEO successfully delivers the visitor and the website loses the sale.
Leads rise, but sales stay flat
This is one of the most overlooked patterns in SEO reporting.
Marketing teams can celebrate a lead increase while sales teams complain that the leads are poor.
Both can be correct.
Suppose organic inquiries rise from 40 to 60. If the number of qualified opportunities remains at 15, additional form submissions have not improved pipeline.
Review qualification criteria.
Look at geography, business size, requested service, budget, job type, deal size, and sales-stage conversion.
If traffic is reaching the wrong audience, refine keyword and content strategy.
If qualified leads are strong but close rates decline, the problem may sit in pricing, sales follow-up, competition, availability, or the offer itself.
SEO cannot be held responsible for every post-lead business issue, but SEO reporting should make those boundaries visible.
Rankings improve, but business results do not
When rankings rise without commercial improvement, inspect what is ranking.
A website can accumulate first-page visibility for definitions, informational questions, careers searches, academic queries, or services it does not prioritize.
That looks impressive in an SEO tool.
It does little for revenue.
Group keyword rankings by intent and business value.
Track visibility for high-priority services, products, categories, locations, and problems that indicate real buying potential.
The goal is not more rankings. The goal is more valuable discovery.
How Often Should You Track SEO KPIs?
A common question is how often should you track SEO KPIs.
The answer depends on what you are tracking.
Some metrics are useful for detecting problems quickly. Others need enough time and data before the trend means anything.
Weekly: monitor for problems
Weekly reviews should be light.
Look for sudden organic traffic declines, tracking failures, important page-indexing issues, severe visibility changes, unexplained conversion drops, or problems with critical pages.
Do not make major strategic decisions because one keyword moved from fourth to sixth on Tuesday.
Search results fluctuate.
Weekly monitoring is for detecting unusual changes that deserve investigation, not for judging the entire SEO strategy.
Monthly: evaluate meaningful performance
The monthly SEO report should be the main operating review for most small businesses.
Compare qualified leads, organic conversions, revenue where available, commercial traffic, non-branded visibility, and other core KPIs.
Add context.
Which pages improved? Which declined? What changed during the month? Did seasonality affect demand? Did a technical issue distort the numbers? Did the company launch a new location or stop offering a service?
A report that contains numbers without explanation transfers the analytical work to the reader.
A good report answers three questions:
What happened? Why do we think it happened? What should we do next?
Quarterly: judge strategy and economics
Quarterly reviews should zoom out.
Look at revenue trends, customer acquisition cost, customer lifetime value where available, lead quality, market share in priority search categories, and performance by service or location.
This is where strategic resource decisions belong.
Should more content budget move toward high-intent service topics? Does a location need stronger local SEO? Are technical limitations holding the site back? Is an entire content cluster attracting traffic without commercial value?
Quarterly analysis is also better for businesses with lower lead volume.
If a company receives only six organic inquiries per month, one lost or unusually large deal can dramatically distort monthly percentages.
Why month-over-month comparisons can mislead
Search demand is seasonal.
An accountant should not panic because tax-related traffic falls in May compared with April. A pool installer may naturally receive less search demand in December than June.
Year-over-year comparisons can help control for seasonality, but they also require judgment.
Products change. Markets change. Google changes. Competitors enter. Search features evolve.
Historical platform data can even be revised, as the 2026 Search Console impression-reporting issue demonstrated.
Use both recent and year-over-year trends, then interpret them in business context.
SEO KPIs Small Businesses Should Not Obsess Over
Some metrics are useful in the right situation but become dangerous when treated as proof of success.
The problem is usually not the metric itself. It is the conclusion drawn from it.
Total backlink count
A growing backlink count can indicate successful authority building.
It can also indicate scraper links, spam, low-quality directories, syndicated pages, or irrelevant sites.
Focus on the quality, relevance, and strategic value of referring domains, not raw link totals.
A respected industry publication linking to an original research page can matter more than hundreds of automated links.
Domain Authority and similar third-party scores
Authority metrics can help compare websites inside a tool’s own ecosystem.
They are particularly useful in link prospecting and competitive research.
They are weak business goals.
No customer buys because your Domain Rating changed from 41 to 44.
If a higher authority score coincides with better commercial visibility, qualified traffic, and revenue, it can help explain progress.
If business performance falls, the score is not a substitute for results.
Raw traffic and total keyword counts
Total traffic encourages teams to chase volume.
That can lead to topics with large search demand but little commercial relevance.
A local accounting firm can publish entertainment content and multiply organic traffic. That does not mean the SEO strategy improved.
Track qualified page groups, relevant non-branded discovery, commercial conversions, and downstream business outcomes.
The same logic applies to total keyword counts.
Ranking for 5,000 queries matters less than ranking for the right 200.
Bounce rate without context
Bounce rate and engagement metrics can help diagnose user behavior, but they are easy to misinterpret.
An informational visitor may read a complete answer, get exactly what they needed, and leave without navigating elsewhere.
A high bounce rate on that page may not indicate failure.
A service page with a high abandonment rate and low conversion rate deserves more attention because its job is different.
Behavior metrics only make sense when interpreted against page purpose and search intent.
A Practical 90-Day SEO KPI Framework
Small businesses can turn this entire measurement system into a manageable 90-day process.
The first step is to stop asking SEO to “increase visibility” without defining the business outcome behind it.
Step 1: Define one measurable business objective
Choose a target the business recognizes.
For a service company:
Generate 25 qualified organic inquiries per month from target service areas.
For ecommerce:
Increase non-branded organic revenue from new customers by 20%.
For B2B:
Generate $150,000 in qualified organic-sourced or organic-influenced pipeline per quarter.
These goals force the measurement system toward commercial value.
“Get more traffic” does not.
Step 2: Choose KPIs across the customer journey
Select one or two indicators for each relevant stage.
For discovery, use non-branded visibility or impressions for priority topics.
For acquisition, track qualified organic clicks or traffic to priority landing pages.
For conversion, track meaningful actions.
For commercial quality, track qualified leads or transactions.
For financial impact, track customers, revenue, CAC, or ROI when attribution is reliable enough.
This creates a connected measurement chain rather than a list of random numbers.
Step 3: Establish a baseline before setting targets
Pull enough historical data to understand normal performance.
Three months can provide an operating baseline for some businesses, but seasonal companies should compare against the same period in the previous year where possible.
Document tracking conditions.
Were forms working correctly? Were calls tracked? Was the CRM capturing source information? Did the website recently migrate? Was there a major promotion?
Targets built on broken or incomplete baselines create false precision.
If attribution is weak, say so.
Trustworthy SEO reporting distinguishes measured facts from estimates.
Step 4: Connect every KPI to a decision
A KPI becomes useful when the team knows what to investigate after it changes.
If non-branded visibility drops, inspect rankings, indexation, competitors, demand, and technical conditions.
If visibility rises but clicks do not, analyze CTR, query mix, and SERP features.
If traffic rises without conversions, inspect audience intent and landing-page performance.
If qualified leads rise without sales, move downstream into CRM and sales data.
If customers and revenue rise while organic CAC declines, identify the pages, queries, locations, and content themes producing the improvement and look for opportunities to scale them.
Measurement should end in a decision, not a PDF.
Three Illustrative Small-Business KPI Scenarios
The following scenarios are hypothetical examples designed to show how the framework works. They are not presented as FiveUp client results or as universal industry benchmarks.
Scenario 1: The HVAC company with “great” traffic growth
An HVAC company grows monthly organic sessions from 8,000 to 10,400, a 30% increase.
The SEO dashboard looks strong until traffic is segmented by landing-page type.
Blog traffic grew from 4,500 to 7,100 sessions after several informational articles began ranking nationally. Traffic to furnace repair, AC installation, emergency HVAC, and location pages declined from 3,500 to 3,300.
Qualified organic calls fell from 81 to 74.
The correct conclusion is not that SEO grew 30%.
The useful conclusion is that informational reach expanded while commercially valuable performance weakened.
The next strategy should protect and improve local service visibility, conversion paths, and high-intent pages while deciding whether the informational content contributes assisted demand.
Scenario 2: The ecommerce company with fewer clicks and more revenue
An ecommerce retailer sees organic clicks decline by 12%.
At first glance, the month appears disappointing.
Further analysis shows most of the decline came from informational articles affected by changing SERP behavior. Traffic to high-margin category and product pages increased modestly.
Organic transactions rose 14%, average order value increased, and organic revenue grew 21%.
A click-only KPI would call the month a loss. Business KPIs call it a win.
The company should still investigate the informational decline, but it should not sacrifice profitable commercial performance simply to restore the traffic graph.
Scenario 3: The B2B firm with fewer but better leads
A B2B company receives 120 organic form submissions in one quarter and 95 the next.
Raw lead volume falls 21%.
In the first quarter, 22 submissions became sales-qualified opportunities. In the second, 34 became qualified.
Average potential deal value also rises because the second-quarter traffic came from more specific buyer-intent terms.
The smaller lead volume creates more pipeline.
This example shows why qualified organic leads, pipeline, and revenue belong above form submissions in mature B2B reporting.
What Makes a Good SEO KPI Target?
One of the most common SEO reporting mistakes is borrowing a benchmark from an unrelated company.
Someone finds a blog post claiming a “good organic conversion rate” is a certain percentage and treats that number as a universal standard.
Industry averages can provide context, but they rarely account for your exact offer, price, geography, sales process, brand strength, website experience, customer journey, or definition of a conversion.
A $19 ecommerce purchase and a $100,000 B2B contract should not share the same conversion expectations.
The strongest benchmark is usually your own clean historical performance.
Start with the current baseline.
Then establish a realistic improvement target based on demand, existing visibility, conversion constraints, resources, and competition.
If a landing page already receives high-intent traffic but converts poorly, conversion optimization may create faster business impact than publishing more content.
If the page converts well but has little visibility, the priority changes.
Targets should identify the bottleneck, not reward arbitrary percentages.
How to Handle SEO Attribution Without Pretending It Is Perfect
SEO attribution is rarely as clean as dashboards imply.
A person can discover the company through an informational search, leave, return through a branded search, read reviews, click an email, and eventually call from another device.
Which channel deserves the sale?
There is no universally correct answer.
Google Analytics itself supports different attribution approaches because different models allocate credit differently. Data-driven attribution can assign fractional credit to contributing interactions, while paid-and-organic last click assigns credit to the final non-direct channel before the key event.
For small businesses, the goal should be decision-quality attribution, not imaginary perfection.
Use analytics for observed digital behavior.
Use CRM and call data for lead and customer outcomes.
Use customer-reported source information carefully as another signal, knowing that people often forget where they first discovered a company.
Compare attribution models where the stakes justify it.
Most importantly, state the limitation when presenting financial numbers.
“Organic search influenced $200,000 in measured pipeline under our current attribution model” is more trustworthy than claiming SEO “generated exactly $200,000” when the buying journey involved several channels.
Frequently Asked Questions About SEO KPIs for Small Businesses
What is the most important SEO KPI for a small business?
There is no universal single KPI because the right answer depends on the business model.
For a mature lead-generation company, qualified organic leads, customers, or revenue usually matter more than rankings or traffic. For an ecommerce store, organic revenue and profitable new-customer acquisition may sit at the top of the hierarchy.
Leading indicators such as non-branded visibility and organic clicks remain important because they explain what is happening before revenue changes.
The best approach is to select a small group of connected KPIs instead of forcing one number to explain the entire search funnel.
How many SEO KPIs should a small business track?
Most small businesses can manage their SEO program with roughly five to seven headline KPIs, supported by diagnostic metrics.
The owner does not need to review every ranking, backlink, crawl statistic, and engagement metric each month.
Marketing teams can keep deeper data available for investigation.
If the main dashboard contains 30 metrics, prioritization is probably missing.
How long should you track SEO before judging results?
There is no reliable universal number of months because SEO outcomes depend on competition, website history, technical condition, content quality, links, search demand, geography, and the scale of the changes being made.
Use leading indicators while waiting for lagging outcomes.
A newly improved page may first show healthier indexation, then impressions, then rankings and clicks, followed by conversions and revenue.
If early indicators remain completely unchanged, investigate sooner rather than waiting for an arbitrary deadline.
If early indicators improve but revenue has not moved yet, determine whether the delay fits the customer journey.
Are keyword rankings still an important SEO KPI?
Yes, but keyword rankings are better treated as leading or diagnostic indicators than as the ultimate measure of success.
Rankings help explain visibility and identify opportunities or declines.
They become misleading when teams optimize for position without considering search volume, intent, click behavior, conversions, and commercial value.
A ranking improvement matters most when it helps the right people discover a page that can move them toward becoming a customer.
The Bottom Line on SEO KPIs for Small Business
The purpose of SEO measurement is not to prove that an SEO team was busy.
It is to determine whether organic search is helping the company reach, convert, and retain valuable customers.
Start with business outcomes.
Measure qualified leads, customers, revenue, organic conversion rate, customer acquisition cost, and SEO ROI where reliable data exists.
Then work backward.
Use organic traffic, non-branded traffic, organic click-through rate, search visibility, keyword rankings, Google Business Profile metrics, indexed pages, Core Web Vitals, and referring domains to explain why those business results are changing.
Add AI search visibility and AI citations as supporting measures when they are relevant, but do not let emerging metrics replace financial reality.
Build the reporting cadence around decisions.
Monitor serious problems weekly. Review meaningful performance monthly. Evaluate economics and strategy quarterly.
Keep the owner’s dashboard deliberately small.
Most importantly, remember that no single graph tells the whole story.
SEO is succeeding when the business is becoming easier for the right people to discover, more effective at turning that discovery into customer action, and more profitable because of it.