

The Google Search Console performance report can tell you which searches bring people to your site, which pages Google shows most often, where rankings are improving, and where organic traffic is slipping.
Yet many site owners use the report as a scoreboard.
They open Search Console, check whether clicks went up or down, glance at average position, and close the tab. That habit misses most of the report’s value.
A proper GSC performance analysis should explain why performance changed and what you should do next. It should help you distinguish a ranking problem from a demand problem, a weak search snippet from poor search intent alignment, and meaningful growth from statistical noise.
The report provides four core Google Search Console metrics: clicks, impressions, click-through rate, and average position. You can group and filter this data by query, page, country, device, date, search appearance, and search type. Used together, these dimensions reveal how Google Search users discover and interact with your content.
This guide explains how to analyze those signals as one connected system. You will learn how to:
- Establish a reliable performance baseline before drawing conclusions.
- Analyze queries, pages, countries, devices, search appearances, and date ranges.
- Find striking-distance rankings, content decay, cannibalization, and CTR opportunities.
- Diagnose traffic drops without blaming every decline on an algorithm update.
- Connect GSC findings with engagement, leads, conversions, and revenue.
- Export and automate analysis through spreadsheets, the API, BigQuery, and Looker Studio.
The goal is not to collect more SEO data. The goal is to make better decisions from the data you already have.
What the Google Search Console Performance Report Actually Measures
The Performance report measures how your verified property appears and performs across eligible Google surfaces.
For standard SEO analysis, you will usually work inside the Search results report. It records how often pages from your property appeared in Google Search, how many clicks they received, their click-through rate, and the average position of the highest result from your property.
This is pre-click data.
Search Console tells you what happened before a visitor reached your website. It shows visibility and interaction within Google Search. It does not tell you whether the visitor read the article, submitted a form, bought a product, or left after five seconds.
That distinction matters.
A page can look successful in Search Console because it earns many clicks, yet perform poorly as a business asset. Another page may receive far fewer clicks but generate valuable leads or sales. You need both search data and on-site analytics to understand the full journey.
Search Results, Discover, Google News, and Generative AI Reports Are Different Views
Search Console can provide separate Performance reports for Search results, Discover, and Google News. Discover and Google News reports appear only when a property has enough eligible data.
These surfaces should not be combined carelessly.
Search traffic is driven by explicit queries. A person types or speaks something into Google. Discover traffic is recommendation-led. Google surfaces content based on a user’s interests and activity. Google News performance is influenced by news relevance, freshness, eligibility, and reader interest.
A headline or page format that performs well in Discover may behave differently in traditional Search. The same applies to news content.
Google also introduced dedicated generative AI reporting in June 2026. This creates a separate view of impressions associated with AI features in Search and Discover. The data remains part of overall Performance reporting, but the dedicated reports make AI visibility easier to isolate.
Choose the report that matches the question you are trying to answer. Use Search results for query-led organic SEO. Use Discover for recommendation traffic. Use Google News for eligible news performance. Use the AI-specific view when examining visibility in supported generative experiences.
How Search Console Assigns Data to Queries, Pages, and Canonical URLs
Search Console often assigns page-level performance to Google’s selected canonical URL rather than the exact URL a person landed on.
Suppose a product is available through several parameterized URLs, but Google considers one clean URL canonical. Performance may be credited to the canonical URL even when a user clicked another version.
This can create confusion during migrations, canonicalization changes, duplicate-content cleanup, and international SEO analysis.
Property-level and page-level figures may also differ because the aggregation method changes. When data is grouped by property, Google generally counts the topmost result from that property. Page-level analysis can count individual URLs differently when several pages from the same property appear in one result set. As a result, property-level CTR and position may look stronger than page-level figures.
Before diagnosing a page, confirm:
- Which URL Google treats as canonical.
- Whether the URL belongs to the property you selected.
- Whether redirects or duplicate versions changed during the comparison period.
- Whether your analysis is grouped by property or page.
Many supposed ranking mysteries are aggregation or canonicalization issues.
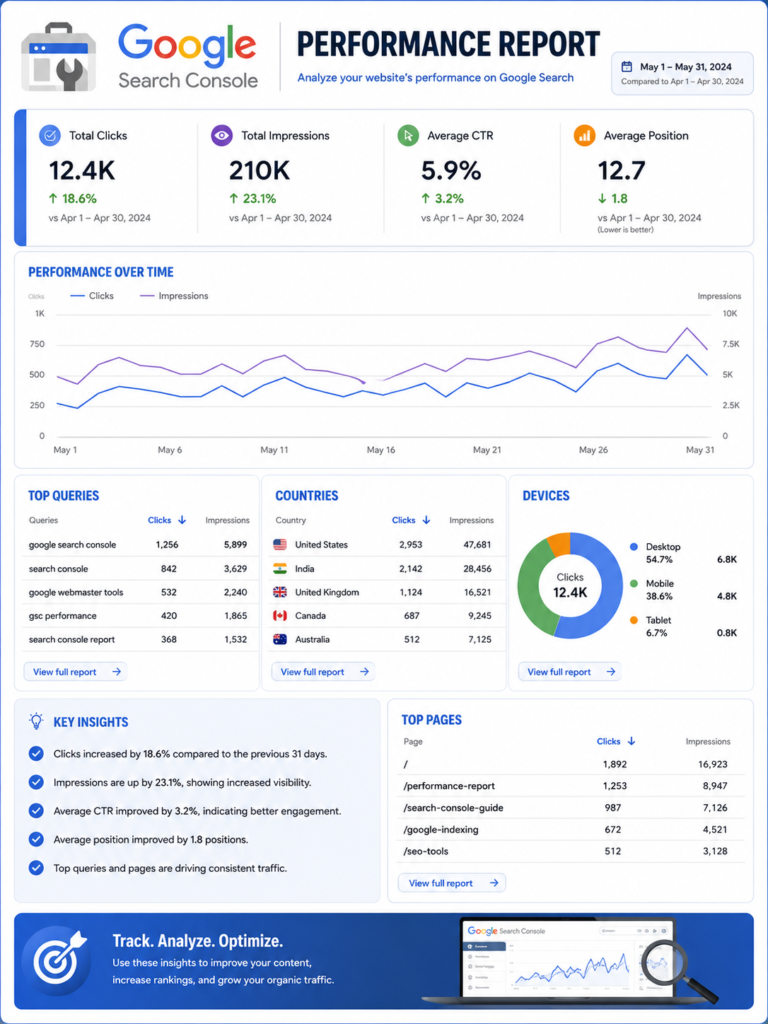
Understand the Four Google Search Console Metrics as a Diagnostic Chain
The four core metrics are connected.
Total impressions measure how often your property was shown. Average position gives ranking context for those impressions. Average CTR shows how often impressions became clicks. Total clicks show how much traffic Google Search sent.
That creates a useful diagnostic sequence:
Visibility creates impressions. Ranking and search-result presentation influence CTR. CTR converts impressions into clicks.
You should rarely make a decision from one metric alone.
Google defines CTR as clicks divided by impressions. Average position reflects the average position of the topmost result from your property or page, depending on how the report is grouped.
The combinations matter more than isolated totals.
| Performance pattern | What it may indicate | What to investigate next |
|---|---|---|
| Impressions rise, position improves, and clicks rise | Genuine organic visibility growth | Identify winning pages, queries, and supporting changes |
| Impressions rise, but clicks stay flat | New query exposure, weak CTR, lower-value rankings, or zero-click results | Segment by query, position, device, intent, and appearance |
| Clicks fall while impressions stay stable | CTR loss, ranking distribution change, or SERP layout change | Compare position bands, snippets, devices, and search features |
| Clicks and impressions fall together | Ranking loss, reduced demand, indexing problem, or lost eligibility | Compare pages, queries, countries, search types, and Google Trends |
| Position improves while clicks decline | Demand loss, query-mix shift, or misleading average | Inspect individual queries instead of the site-wide average |
| CTR improves while impressions decline | Remaining impressions may come from stronger rankings or branded searches | Check which queries disappeared and whether demand changed |
| Impressions grow while average position worsens | Google may be testing the site across more lower-ranking queries | Analyze newly appearing queries and relevant landing pages |
| Clicks grow while average position stays flat | Demand, CTR, or query coverage may have improved | Compare impression growth and query mix |
Use this table as a starting point, not a final diagnosis. The same pattern can have several causes.
Total Clicks and Total Impressions: Traffic Acquired Versus Visibility Earned
A click is counted when a user clicks a result that leads outside Google to your property. An impression is counted when a result is shown according to the counting rules for that result type.
An impression does not always mean the user studied your listing. Some result formats require the item to be visible, while other result types may count impressions based on how the result is loaded or displayed. Google’s impression rules can also vary by search feature.
This means impressions should be treated as evidence of search visibility, not confirmed attention.
Rising impressions can be positive. They may show that Google is ranking your content for more queries, in more markets, or across a wider set of positions.
They can also dilute your other metrics.
Imagine that a page ranks in position three for 2,000 impressions and later begins ranking between positions 40 and 70 for 20,000 loosely related impressions. Its total visibility rises sharply, but average position and CTR may fall. That does not mean the page lost its strong ranking. It means its query footprint expanded.
Clicks provide a clearer measure of acquired organic visits, but they still need context. A click from a branded support query has a different business value from a click on a high-intent product comparison.
Analyze click quality through landing-page engagement and conversion data rather than assuming every click is equal.
Average CTR: Interpret Click-Through Rate by Position, Intent, Device, and SERP Layout
CTR measures the percentage of impressions that generated clicks.
A page with 1,000 impressions and 50 clicks has a 5 percent CTR.
The calculation is simple. Interpretation is not.
A 2 percent CTR can be strong for a non-branded query near the bottom of page one. It can be weak for a branded query in the top position. A commercial result may attract clicks differently from a definition query that Google can answer directly on the result page.
CTR is affected by:
Ranking position, query intent, brand recognition, title wording, snippet relevance, freshness, device, ads, local packs, shopping blocks, videos, image results, featured snippets, AI features, and other search-result elements.
Do not compare every query with one universal CTR target. Build internal benchmarks from queries that share similar conditions.
Compare non-branded mobile queries in positions four to six with other non-branded mobile queries in positions four to six. This produces a far more useful benchmark than comparing them with the site-wide average.
Average Position: Why It Is a Trend Signal, Not a Rank Tracker
Search Console’s position metric is an average across impressions. It does not claim that your page ranks in the same position for every user.
Results can vary by location, device, language, time, personalization, query variation, and search-result format. A page may rank second in one market, ninth in another, and thirty-fifth for a loosely related variation.
The combined average might be 8.7.
That number is useful for trend analysis. It is weak as a single, exact ranking statement.
A site-wide average position is even more abstract. New impressions from hundreds of low-ranking queries can push the average down while your priority keywords remain stable. The opposite can happen when low-ranking queries disappear from the dataset.
Use average position to locate possible changes. Then narrow the report by query, page, country, device, and date before taking action.
For priority terms, combine GSC trends with live SERP inspection and a dedicated rank-tracking process. Search Console tells you how your property performed across real impressions. A rank tracker provides controlled observations for chosen keywords and locations. They answer different questions.
Configure a Reliable Baseline Before Analyzing GSC Performance
Weak analysis often begins with the wrong baseline.
The analyst chooses the default three-month view, compares it with the previous period, sees clicks down 12 percent, and assumes the site lost rankings.
Perhaps the business is seasonal. Perhaps the previous period included a holiday spike. Perhaps branded demand fell while non-branded discovery grew. Perhaps desktop declined while mobile increased. Perhaps a tracking change affected another analytics platform but not Search Console.
A reliable baseline should define the property, scope, market, device, search type, date range, and business question.
Before starting, confirm:
- The correct Domain or URL-prefix property is selected.
- The report contains the relevant protocol, subdomain, language, and directory.
- The search type matches the content format being analyzed.
- The comparison accounts for seasonality and day distribution.
- Existing query, page, country, device, and appearance filters are visible.
- Major releases, migrations, content changes, and technical incidents are documented.
Choose the Correct Domain Property, URL-Prefix Property, Directory, and Market
A Domain property includes data across subdomains and protocols for the verified domain. A URL-prefix property covers only URLs that begin with the specified prefix.
This creates meaningful analytical differences.
A Domain property can be useful for evaluating overall search visibility across www, a blog subdomain, a store subdomain, and other hosts. It may be too broad when you need to isolate one language directory, protocol, or subdomain.
Google recommends a URL-prefix property when you need data limited by a particular protocol or path structure.
For a multilingual site, do not rely only on one global average. Filter directories such as /en/, /de/, or /ae/. Then add country filters to see whether each version appears in its intended market.
For a marketplace or large publisher, create recurring views for major sections. Categories, product pages, editorial pages, tools, forums, and support content often have very different search patterns.
A property-wide trend can hide a serious decline in a commercially important directory.
Select the Right Date Range and Comparison Period
A Google Search Console date comparison should reflect the question you are asking.
Use a short comparison when checking a recent release, technical incident, migration, title change, or indexing problem. Use a longer comparison when assessing content strategy, sustained ranking changes, or seasonal performance.
Previous-period comparisons work well for stable businesses without strong seasonality. Year-over-year comparisons are often better for travel, retail, education, events, tax, finance, weather-related demand, and other seasonal industries.
Check the day distribution too.
A 28-day period contains an equal number of weekdays. A calendar-month comparison may compare 31 days with 30, or include different numbers of weekends. This can matter for B2B sites whose demand drops sharply on Saturdays and Sundays.
Search Console provides up to 16 months of Performance data in the standard historical view, which allows year-over-year comparison but does not provide unlimited storage.
Export data continuously when long-term historical analysis matters.
Use Weekly and Monthly Views, the 24-Hour View, and Custom Annotations
Daily charts are useful for spotting sudden changes. They can also distract you with normal volatility.
Google added weekly and monthly views to help users analyze longer trends with less daily noise. Weekly aggregation works well for regular performance reviews. Monthly aggregation is useful for strategy, seasonality, and executive reporting.
The 24-hour Search Console view serves a different purpose. It provides recent, hourly data in Search results, Discover, and Google News reports. Google may display incomplete recent points with a dotted line while data collection is still in progress.
Use the 24-hour view for time-sensitive monitoring, such as:
A major news article, product launch, live event, migration, site outage, urgent technical fix, or sudden visibility change.
Do not use it to judge the long-term success of an evergreen article after a few hours.
Custom chart annotations let you place notes directly on Performance charts. Record dates for migrations, internal-link projects, template changes, content refreshes, title tests, redirects, releases, and outages.
Without annotations, teams often remember the result but forget what changed.
Start Every GSC Performance Analysis With a Specific SEO Question
Opening Search Console without a question encourages random sorting.
You click Queries, sort by impressions, notice a few terms, move to Pages, change the date, apply a country filter, and leave with several observations that do not lead to a decision.
Begin with one clear question.
For example:
Why did non-branded clicks decline last month? Which pages gained mobile visibility? Which commercial queries rank between positions five and fifteen? Did the content refresh improve CTR? Which directory is responsible for the site-wide drop?
Then configure the report to answer that question.
Use a Question-to-Report Analysis Matrix
The matrix below connects common SEO questions with the report setup that is most likely to answer them.
| SEO question | Recommended configuration | Likely next step | Likely next step |
|---|---|---|---|
| Why did organic clicks decline? | Compare dates, then segment by page, query, country, device, and search type | Clicks, impressions, position, CTR | Isolate the segment causing the loss |
| Which keywords offer quick ranking gains? | Query view, non-branded filter, positions near page one, meaningful impressions | Position, impressions, CTR | Improve the matching page and internal support |
| Which pages need title improvements? | Page view, then inspect queries with stable position and weak CTR | CTR, position, impressions | Review live snippets and test clearer titles |
| Is brand demand masking weak SEO acquisition? | Compare branded and non-branded query performance | Clicks, impressions, CTR | Measure discovery growth separately |
| Did a content refresh work? | Filter the edited page and compare pre-change and post-change periods | Query coverage, clicks, impressions, position | Keep, refine, or reverse the change |
| Is mobile causing the decline? | Compare mobile and desktop over the same dates | Clicks, CTR, position | Inspect mobile SERPs, UX, and page templates |
| Are multiple pages competing for one query? | Filter one query, then open the Pages dimension | Impressions, clicks, position by URL | Merge, differentiate, or strengthen the intended page |
| Is traffic loss caused by lower search demand? | Compare impressions and position, then validate with Trends | Impressions, stable position | Adjust forecasts or expand into growing topics |
| Which countries offer expansion potential? | Country dimension, then filter relevant pages and queries | Impressions, CTR, position | Localize content and strengthen market targeting |
| Are rich results improving performance? | Compare search appearance categories | CTR, impressions, clicks | Maintain eligibility and expand valid markup |
This approach keeps analysis focused. It also makes reporting easier because every chart answers a defined question.
Separate Observation, Diagnosis, Recommendation, and Expected Outcome
An observation is not a diagnosis.
“Clicks fell 18 percent” is an observation.
“Clicks fell because non-branded mobile impressions declined across three product-category pages after those pages were removed from the index” is a diagnosis supported by evidence.
“Restore indexability, validate canonical tags, resubmit the relevant sitemaps, and monitor recovery” is a recommendation.
“Non-branded impressions and clicks should begin returning after affected URLs are recrawled and indexed” is the expected outcome.
Use this four-part structure for every meaningful finding:
Observation: What changed?
Diagnosis: What evidence explains the change?
Recommendation: What specific action should be taken?
Expected outcome: Which metric should change if the diagnosis is correct?
This discipline prevents vague SEO reports filled with screenshots but no decisions.
Analyze Search Queries by Demand, Intent, Brand, and Opportunity
The search queries report reveals the language people use when your site appears in Google.
It can show which topics Google associates with your content, how searchers describe their problems, which modifiers signal commercial intent, and where your landing pages do or do not match demand.
Do more than sort queries by clicks.
Clicks often favor terms you already perform well for. Impressions reveal broader visibility. Position provides context. CTR shows whether the result attracts selection.
Analyze queries in groups that reflect how people search and how your business serves them.
Compare Branded and Non-Branded Queries
Branded queries contain your brand, product, company, domain, founder, or a recognized variation. They often earn high rankings and CTR because the searcher already knows what they want.
Non-branded queries represent broader discovery. The searcher may know the problem, category, or product type without knowing your company.
Both matter, but they measure different strengths.
Branded performance reflects demand, reputation, customer activity, offline marketing, public relations, and brand familiarity. Non-branded performance is a better indicator of whether SEO reaches people who have not already chosen your brand.
Google introduced an automated branded-query filter for eligible properties. Google notes that the feature may not be available to sites with low impression volume and that classifications can sometimes be imperfect. Its available history also begins from the feature’s introduction rather than covering unlimited past data.
Where the automated filter is unavailable or needs refinement, create a manual regular expression containing brand names, misspellings, product names, abbreviations, domain variations, and founder names.
Track the branded-to-non-branded balance over time.
A site can report organic growth while becoming increasingly dependent on branded searches. That is not necessarily bad, but it tells a different story from category-level discovery growth.
Classify Informational, Commercial, Navigational, and Transactional Queries With Regex
Search Console filters let you narrow data by several dimensions at once. You can filter for a country, device, page, query pattern, search appearance, and date range to create a highly specific view.
Google Search Console regex is especially useful for grouping queries that share words or patterns.
You can group informational searches containing terms such as “how,” “what,” “why,” “guide,” or “tutorial.”
Commercial investigation patterns might include “best,” “top,” “review,” “versus,” “alternative,” “comparison,” or “price.”
Transactional searches can contain “buy,” “book,” “download,” “quote,” “order,” “near me,” or location modifiers.
Navigational patterns can include your brand, login terms, support queries, account pages, or named resources.
Google uses RE2-style regular expressions in Search Console. Regex filters can match several variations in one rule, which is useful for branded terms, directories, question phrases, and product families.
Keep intent classification practical.
A word does not guarantee intent. “Best way to clean leather shoes” may be informational, while “best leather shoe cleaner” may show stronger product interest. Review the result page and the ranking content before assigning a business value.
Use Query Groups and Long-Tail Patterns to Find Topic-Level Demand
Individual GSC rows often contain many variations of the same underlying need.
A site may receive impressions for:
“How to analyze Search Console data,” “analyzing GSC performance,” “how to read Search Console reports,” and “Google Search Console analysis.”
Treating each phrase as an isolated keyword can create repetitive content and fragmented decisions.
Query groups in Search Console Insights cluster similar queries so users can see broader search-interest patterns across alternate wording, misspellings, languages, and closely related expressions.
Use those groups to identify topics, then return to the detailed Performance report for page, country, device, and date analysis.
Long-tail queries are especially valuable because they reveal specificity.
They can expose missing subtopics, objections, audience types, use cases, locations, problems, and product attributes. A page receiving early impressions for relevant long-tail phrases may need a stronger explanation, a new section, a clearer example, or better internal links.
Do not create a new page for every variation. Create one when the query represents a distinct intent that the current page cannot satisfy without becoming unfocused.
Analyze Page Performance as a Content Portfolio
The page performance report shows which URLs earn visibility and clicks.
Page-level analysis becomes more useful when pages are classified by business role.
A product page should not be evaluated against an educational glossary page using the same success standard. A product page may target lower-volume commercial queries and generate revenue. A glossary page may earn broad impressions and links without converting directly.
Group pages by template, directory, topic cluster, funnel stage, market, or conversion goal.
Then compare similar pages.
This reveals whether a problem affects one article, a content type, or an entire template.
Find Winning Pages and Understand Why They Perform
Start with pages that gained clicks, impressions, query coverage, and stable or improving positions.
Do not stop at naming the winners. Investigate why they won.
Open each page’s query data. Check whether growth came from one high-volume term or a broader set of related searches. Compare branded and non-branded traffic. Review countries, devices, and search appearances.
Then examine the page itself.
Does it answer the query quickly? Is its title clear? Does it contain original evidence, useful examples, strong visuals, or first-hand experience? Is it well linked from other relevant pages? Does the format match what Google currently ranks?
Winning pages can reveal repeatable patterns.
Perhaps comparison pages work better than generic category pages. Perhaps location pages with real local information outperform thin templates. Perhaps expert-reviewed guides earn broader query coverage than short articles.
Use winners to improve the rest of the portfolio, but do not copy them mechanically. The lesson may be depth, format, intent alignment, authority, or internal support rather than word count.
Detect Content Decay Before Traffic Loss Becomes Severe
Content decay analysis identifies pages whose organic performance weakens over time.
A page may lose clicks because rankings fell. It may also lose traffic because the topic became less popular, competitors improved, the content became outdated, or Google changed how it answers the query.
Compare meaningful periods and inspect the metric pattern.
Clicks down, impressions down, and position down often suggest visibility loss.
Clicks down and impressions down with stable position can indicate reduced demand.
Clicks down with stable impressions and position may indicate a CTR or result-page change.
Position down while query coverage expands can reflect a mixed picture rather than straightforward decay.
Review declining pages individually. Check their query distribution, current content, search intent, competing results, internal links, technical status, and business value.
Possible actions include refreshing the content, adding missing evidence, improving examples, correcting outdated information, consolidating overlap, strengthening internal links, changing the format, or leaving the page alone when demand has naturally declined.
A refresh should have a reason. Updating the publication date without improving the page does not solve content decay.
Find Pages Google Is Testing for New Queries
A page with rising impressions but limited click growth may be entering more search auctions.
Google may be testing it for new terms, markets, devices, or lower positions. This can be an early sign of opportunity.
Compare query lists across periods. Look for relevant terms that appear in the new period but not the old one.
Ask whether the page already answers those searches.
If it does, improve the clarity and prominence of the relevant section. Strengthen internal anchors and supporting links. Make the title and headings reflect the broader need without making the page vague.
If the query reflects a distinct intent, create a dedicated page only when you can provide a complete answer and a meaningful reason for that page to exist.
Ignore irrelevant impressions unless they expose a genuine targeting problem. Pages can appear occasionally for loosely connected queries without requiring a rewrite.
Find and Prioritize Striking-Distance Keywords
Striking-distance keywords are relevant queries that rank close enough to a high-visibility position that focused improvements may produce meaningful gains.
There is no universal position range.
For one site, striking distance might mean positions four to ten. For another, it may include positions eleven to twenty because the page has strong relevance but weak authority. A high-value term at position twenty-two may deserve more attention than a low-value term at position six.
Use the term as an opportunity category, not a fixed rule.
Score Opportunities by Impressions, Position, CTR Gap, Intent, and Business Value
A useful opportunity score should consider:
Search visibility, current position, query relevance, business intent, potential traffic, conversion value, existing page quality, implementation effort, and confidence in the diagnosis.
High impressions alone are not enough.
A broad informational term may produce thousands of impressions but little business value. A lower-volume commercial query may influence large purchases.
Position also needs context.
Moving from position eleven to eight may create more impact than moving from position fifty to thirty. Moving from position three to two may generate substantial gains for a high-demand query, but competition can make that improvement difficult.
Add a confidence factor.
A page ranking eighth for a query that closely matches its purpose has a clearer opportunity than a page ranking eighth because Google loosely associates it with the topic.
Prioritize queries where:
The landing page is relevant, the search intent supports your business, impressions are meaningful, the current position is competitive, the weakness is identifiable, and the proposed action is realistic.
Match the Optimization Action to the Cause
Do not respond to every striking-distance keyword by adding more text.
A page can rank below its potential for several reasons.
The content may not answer an important subtopic. The internal-link structure may be weak. The title may target a different phrase. The page may lack credible evidence. Another internal page may compete with it. The format may not match the current results. Stronger competing pages may have better authority or clearer experience.
Match the action to the evidence.
Improve content depth when the page leaves key questions unanswered.
Strengthen internal links when the page is relevant but isolated.
Consolidate overlap when several pages divide signals.
Revise the title and opening when the page’s purpose is unclear.
Create a separate page when the query represents a distinct need.
Build authority when the content is strong but the competitive gap remains external.
Validate the Opportunity on the Live SERP
Search Console tells you how your site performed. It does not show the complete result-page environment that produced those numbers.
Search the query using an appropriate location and device setup.
Study the dominant intent. Check whether Google ranks guides, category pages, product pages, tools, videos, forums, local results, or mixed formats.
Look at the space available to traditional organic results. Ads, shopping modules, maps, videos, images, featured snippets, discussions, and AI-generated experiences can change the likely click opportunity.
A ranking improvement does not guarantee a proportional traffic increase when the result page satisfies users before they click.
SERP validation prevents you from investing heavily in queries where your current page type is unlikely to compete or where click potential is structurally limited.
Diagnose High-Impression, Low-CTR Queries Without Guessing
High-impression low-CTR queries are often described as easy SEO wins.
Sometimes they are. Sometimes low CTR is expected.
A query ranking at position twelve will usually receive a lower CTR than one ranking second. A non-branded informational result may attract fewer clicks than a branded login query. A result surrounded by ads, videos, shopping listings, and an AI answer has a different click environment from a simple result page.
Begin by asking whether the CTR is weak for its context.
Compare CTR Only Within Similar Position, Intent, Device, and Search Appearance Groups
Create fair comparison groups.
Separate branded from non-branded searches. Separate mobile from desktop. Compare similar position ranges. Group informational queries apart from commercial queries. Review search appearances independently when rich-result eligibility affects presentation.
Then calculate an internal benchmark.
Suppose non-branded mobile queries in positions four to six average a 4.2 percent CTR. A high-value query in the same group has a 1.1 percent CTR across enough impressions. That is a more credible optimization opportunity than a query that merely falls below the site-wide average.
Use enough data to avoid reacting to chance.
A query with three impressions and zero clicks has a zero percent CTR, but no useful conclusion. A query with 20,000 impressions has a stable enough sample to deserve attention.
Audit Titles, Snippets, Freshness Signals, and Search-Intent Match
Review the live result, not only the HTML title and meta description.
Google may generate a title link or snippet from page content when it believes another representation fits the query better.
Ask whether the result makes a clear promise.
Does it describe the page precisely? Does it mention the most relevant benefit, product type, audience, location, or use case? Does it look current? Does it differ meaningfully from competing results?
Avoid empty clickbait. A title that earns clicks but disappoints users can weaken engagement and trust.
Review search intent too.
A page titled “Complete Guide to CRM Software” may struggle for “CRM software pricing” if users want pricing tables, plans, and cost comparisons. Rewriting the title will not solve a format mismatch.
The snippet should confirm that the page provides the answer implied by the title.
Account for AI Answers and Other SERP Features
CTR can fall even when rankings remain stable.
The result page itself may have changed.
Google may add an AI-generated response, featured snippet, expanded People Also Ask section, video carousel, shopping block, local results, or other features. These can answer the query or push traditional links lower on the visible screen.
Do not assume a stable average position means stable visual prominence.
Check the live SERP across devices. Review the search appearance report for eligible result types. Compare the timing of CTR changes with major result-page changes.
For low-click informational queries, your strategy may need to include visibility and brand exposure rather than click volume alone. For commercial queries, strong page differentiation and clearer value remain important because users are more likely to continue evaluating options.
Detect Keyword Cannibalization and Landing-Page Intent Mismatch
Keyword cannibalization in Search Console occurs when several pages compete for the same or closely related search intent in a way that weakens performance.
Multiple ranking URLs are not always a problem.
A retailer can rank a category page and an informational guide for the same broad topic because they serve different needs. A publisher may rank several relevant articles for a complex query.
Cannibalization becomes harmful when Google cannot identify the best page, rankings switch repeatedly, internal pages divide links and relevance, or a weaker URL outranks the intended destination.
Analyze Queries to See Which Pages Google Selects
Filter the report by one important query. Then open the Pages dimension.
Review which URLs received impressions and clicks during the selected period.
Compare several periods to see whether the leading URL changes.
A stable primary page with occasional impressions from supporting content may be normal. Frequent switching between two highly similar pages suggests ambiguity.
Check device and country segments too. Google may select one page in one market and another elsewhere because localization, page experience, or internal linking differs.
Do not rely only on clicks. A page can receive few clicks because it ranks lower while still competing for impressions.
Analyze Pages to See Whether Their Query Sets Are Coherent
Reverse the process.
Choose a page and inspect all queries associated with it.
A strong page usually has a coherent query footprint. The wording varies, but the underlying need remains connected.
A page ranking across several incompatible intents may be too broad. For example, one URL may attract impressions for definitions, software comparisons, pricing, troubleshooting, and login searches. That does not always mean it should be split, but it deserves review.
Identify the page’s primary job.
Its title, headings, introduction, examples, internal links, and conversion action should support that job.
Supporting subtopics can remain when they help the main intent. Separate them when each requires a different format, audience, or next action.
Decide Whether to Merge, Differentiate, Redirect, or Create a New Page
Merge pages when they answer the same need and neither provides a unique reason to exist.
Differentiate them when each serves a legitimate but unclear intent. Rewrite titles, headings, introductions, internal anchor text, and supporting sections to make their roles distinct.
Redirect a weaker page when its content is redundant and its useful value can be incorporated into a stronger URL.
Create a new page when the query reflects a separate intent that the current page cannot address well.
After making changes, annotate the date and monitor:
Which URL earns impressions, whether ranking volatility declines, whether combined clicks improve, and whether the intended page becomes dominant.
Cannibalization work should improve user choice, not merely force one URL to rank.
Segment Performance by Device, Country, Search Type, and Search Appearance
Site-wide data is an average of many audiences and search environments.
Segmentation shows where change occurred.
A property may report flat clicks while mobile grows and desktop declines. Global traffic may increase while the priority market loses visibility. Web Search may fall while image traffic rises. One rich-result type may lose eligibility while standard results remain stable.
Use segmentation after identifying any meaningful trend.
Compare Mobile, Desktop, and Tablet Performance
Device performance can differ because user behavior, result-page layout, intent, ranking, and presentation differ across screens.
Mobile results may show fewer traditional links above the fold. Local, shopping, image, and AI features can occupy more visible space. Titles may wrap differently. Searchers may use shorter or more immediate queries.
Compare clicks, impressions, CTR, and position by device.
If mobile clicks decline, determine whether mobile impressions fell, rankings weakened, or CTR dropped.
Then inspect the affected pages on real devices.
A mobile problem may come from the result page rather than the landing page, but post-click experience still matters. Slow loading, obstructive elements, poor readability, broken layouts, and difficult forms can reduce the business value of acquired traffic.
Do not assume desktop patterns explain mobile behavior.
Analyze Country-Level Visibility and Localization
Country performance helps international businesses identify where content appears and where opportunities or problems exist.
Start with clicks and impressions by country. Then filter each priority market and inspect queries and pages.
Check whether users see the correct language, currency, availability, legal information, product range, and contact options.
A page can rank internationally without being suitable for every market. High impressions from an unsupported country may create weak CTR because the result is irrelevant or inaccessible.
For multilingual sites, compare the ranking URLs in each country. The wrong language version may appear because of weak localization signals, inconsistent internal linking, canonical errors, or content similarity.
Do not interpret global averages as international SEO success.
Measure each target market against its purpose.
Compare Web, Image, Video, News, and Search Appearance Data
Search Console can separate eligible search types such as Web, Image, Video, and News. Availability depends on the report and property data.
This helps explain performance changes that are invisible in a combined view.
An ecommerce site may earn valuable discovery through image search. A tutorial site may gain video visibility. A news publisher may see a temporary spike that does not represent evergreen search growth.
Search appearance data identifies eligible result formats or features associated with your pages. Structured data and rich-result eligibility can influence how listings appear and how users respond. For example, Google provides search appearance filtering for supported result types such as review snippets.
Compare appearance groups carefully.
Higher CTR may reflect better presentation, but it can also reflect stronger positions, different queries, or branded demand. Filter further before crediting the appearance alone.
Investigate Search Traffic Drops, Spikes, and Performance Anomalies
A proper Google search traffic drop analysis begins by classifying the change.
Do not start with a list of algorithm updates.
Organic traffic can decline because of technical problems, security issues, ranking changes, seasonality, reduced search demand, content changes, migrations, manual actions, competitor improvements, reporting anomalies, or changed result-page layouts.
Google recommends using the Performance report with Google Trends to investigate whether a drop is site-specific or related to wider search demand.
Classify the Shape of the Change
Look at when the change started and how quickly it developed.
A sharp site-wide drop on one date may indicate a technical incident, migration issue, manual action, security problem, major ranking change, or data anomaly.
A gradual decline across several months may point toward competition, content aging, lost demand, weakening relevance, or accumulated technical problems.
A repeated annual pattern suggests seasonality.
A decline limited to one directory points toward a template, content type, or internal-link issue.
A country-specific drop may involve localization, availability, competition, or regional demand.
A device-specific drop may relate to mobile SERP changes, page experience, or device-dependent intent.
Graph clicks and impressions together. Add position and CTR. The combination narrows the possibilities.
Separate Demand Changes From SEO Visibility Changes
Suppose impressions fall by 30 percent while average positions for priority queries remain stable.
The site may not have lost rankings. Fewer people may be searching for those topics.
Check query-level impressions. Compare branded and non-branded segments. Use Google Trends to review category interest and seasonality.
A demand decline requires a different response from a ranking decline.
You may need to adjust forecasts, expand into growing topics, develop products for changing needs, or accept that a seasonal page will not maintain peak traffic throughout the year.
A sudden branded-search decline can also reflect reduced advertising, media activity, customer interest, or offline awareness. SEO work alone may not restore it.
Validate Technical, Algorithmic, and SERP-Level Causes
When ranking or impression losses appear site-specific, inspect technical evidence.
Check indexing status, robots directives, canonical tags, server availability, redirects, migrations, manual actions, security issues, and major template changes.
The URL Inspection tool can show Google’s indexed version of a page, canonical information, and whether a live URL may be indexable.
Compare the timing with documented ranking updates, but do not assume correlation proves causation. Review which pages and queries lost visibility. A broad quality-related decline looks different from a directory blocked by noindex.
Inspect the current SERP too. New competitors, features, AI responses, shopping modules, or local results can reduce clicks even without a large ranking loss.
Check Search Console’s data-anomalies record when a chart contains an unexplained reporting spike or drop. Google documents known issues that may affect report data.
Analyze AI Overviews and AI Mode With the Generative AI Performance Report
The Generative AI performance report gives site owners a dedicated view of impressions within supported generative features.
Google announced separate reports for Search and Discover in June 2026. The Search report covers visibility in features such as AI Overviews and AI Mode, while the Discover version covers supported generative experiences within Discover.
This is a developing measurement area. Treat the report as a visibility signal, not a complete conversion system.
Identify Pages Receiving Generative AI Impressions
Start with pages that earn the most AI-related impressions.
Group them by content type and topic.
You may find that detailed explanations, first-hand reviews, technical documentation, reference pages, comparison content, or concise factual resources appear more often.
Do not assume that copying those pages’ writing style will produce AI visibility.
Look for deeper qualities.
Does the page answer specific questions clearly? Does it contain original experience, definitions, evidence, examples, structured sections, or distinct information? Is the site recognized for that topic? Is the information current and easy to verify?
Compare AI-visible pages with standard search performance. Some may earn strong AI visibility and few direct clicks. Others may benefit across both.
Use the report to identify patterns worth studying, not to claim a direct ranking formula.
Segment AI Visibility by Device and Country
AI features do not appear identically for every user, query, device, or market.
Segment impressions by country and device where the report allows it.
A site may gain visibility in one market before another. Mobile and desktop exposure may differ. Localized content may perform differently across regions.
Rollout availability also matters. Absence of impressions does not prove that a page lacks eligibility or value. The report itself may not yet be available for every property, and feature availability can vary.
Track trends over time rather than judging isolated days.
Avoid Treating AI Impressions as Conversions or Traditional Rankings
An AI impression is not a site visit.
It also should not be interpreted as a conventional position in a list of ten blue links.
Generative results can present information and references in formats that change across queries and sessions. Visibility can influence brand recognition or later searches without creating an immediate click.
Connect AI visibility with other signals:
Branded search growth, assisted conversions, direct traffic, referral patterns, user research, lead quality, and standard organic performance.
Avoid inflated reporting such as “AI traffic grew” when the report shows impressions rather than visits.
Use precise language: the site received more visibility within supported generative Search features.
Understand GSC Data Limits, Missing Queries, and Reporting Discrepancies
Search Console contains real and valuable data, but it is not a complete record of every query and interaction.
Understanding its limits is part of responsible SEO analysis.
The most common confusion comes from table limits, privacy filtering, aggregation, canonicalization, and differences between Search Console and web analytics.
Account for the 1,000-Row Interface Limit and Anonymized Queries
Performance tables in the interface can be limited to 1,000 rows. Large sites can have far more queries, pages, and combinations than the interface displays.
Google also omits some low-frequency queries from query tables to protect user privacy. These are often called anonymized queries.
Their clicks and impressions may remain included in chart totals when no query filter is active, while the individual query text is hidden. If you apply a query filter, those anonymized rows cannot be matched, so filtered totals can change in ways that surprise analysts.
This explains why adding the visible query rows may produce a smaller number than the headline total.
Do not invent missing keywords or treat the difference as a tracking error.
Report visible query trends while acknowledging that a portion of long-tail activity may remain undisclosed.
Understand Aggregation, Canonicals, and Average-Position Distortion
Grouping changes how data is counted.
Property aggregation can combine several results from the same site and report the topmost position. Page aggregation evaluates URLs separately. This can produce different impressions, CTR, and position figures.
Canonicalization can assign performance to the canonical URL instead of the exact clicked URL.
Averages can also change because the underlying mix changes.
Suppose a site loses 10,000 low-ranking impressions while retaining 1,000 high-ranking branded impressions. Its average position and CTR may improve even though total discovery shrank.
The reverse can occur when Google begins showing the site for thousands of new queries at low positions. Visibility expands while average position falls.
Whenever a major average changes, inspect its distribution:
Which queries were added or lost? Which pages contributed? Did branded share change? Did countries or devices shift? Did lower-ranking impressions expand?
Averages summarize. They do not explain.
Explain Why GSC Clicks and GA4 Organic Sessions Do Not Match
A Search Console click and a Google Analytics session are different events.
Search Console records interactions in Google Search. GA4 records website activity when its measurement system runs and processes a session.
A user can click a search result but fail to load the page. Consent restrictions, JavaScript blocking, browser settings, redirects, tag failures, slow loading, and measurement configuration can prevent a GA4 session from appearing.
One person can also generate several clicks within one session, or one click can result in unusual attribution depending on the journey.
Time zones and reporting systems differ too.
Use Search Console as the primary record for Google Search impressions, clicks, queries, and positions. Use GA4 for on-site engagement, events, attribution, and conversions.
Google recommends analyzing the systems together because they cover different stages of the user journey.
Export and Automate Google Search Console Performance Analysis
Manual analysis is enough for a small site or occasional review. Larger properties need repeatable exports and stored history.
A mature reporting setup often progresses through four stages:
The Search Console interface, spreadsheet exports, the API, and BigQuery-based analysis.
Choose the simplest method that answers the question reliably.
Export Filtered Reports to Google Sheets, Excel, or CSV
A standard GSC data export is useful when you need to sort, classify, calculate, chart, or share data outside Search Console.
Search Console can export Performance data to Google Sheets, Excel, or CSV. A full export can include separate tabs for queries, pages, countries, devices, search appearances, dates, and applied filters.
Check the filter tab before sharing the file.
A report titled “Organic performance” may represent mobile users in one country, one directory, and one search type. Without the filter context, another person can misread it as property-wide data.
Spreadsheets work well for query classification, opportunity scoring, page groups, month-over-month comparisons, and annotation logs.
Store recurring snapshots if you need history beyond Search Console’s standard retention window.
Use the Search Console API for Repeatable Query and Page Analysis
The Search Console API supports automated requests for Search Analytics data.
You can specify dates, dimensions, search types, filters, aggregation rules, and row limits. The Search Analytics query method currently supports up to 25,000 rows in one request, with pagination through the startRow parameter.
The API suits recurring processes such as:
Monthly query exports, automated content-decay checks, directory scorecards, country dashboards, branded and non-branded reporting, page-query mapping, and anomaly detection.
It does not remove every data limitation. Privacy filtering and aggregation rules still matter.
Build validation into automated workflows. Confirm date ranges, time zones, filters, duplicate rows, missing days, and sudden changes before distributing results.
Automation can spread an error faster than manual reporting.
Use BigQuery Bulk Export and Looker Studio for Enterprise Reporting
Search Console BigQuery bulk export sends ongoing daily Performance data to a BigQuery project.
Google states that the bulk export is not restricted by the standard daily data-row limit. It includes broad performance data but still excludes anonymized queries for privacy. Only property owners can configure the export.
BigQuery is useful for large websites that need long-term storage, page-query combinations, custom business classifications, multiple properties, or joins with other datasets.
Cost control matters. Query only the dates and columns you need. Avoid scanning every field by default. Google recommends limiting input scans, using date filters, building aggregated tables for dashboards, and applying sampling or approximate functions where exact results are unnecessary.
A Looker Studio Search Console dashboard can present trends to stakeholders without requiring them to explore raw tables.
Create separate dashboard layers.
Executives may need clicks, non-branded growth, high-value landing pages, market performance, and conversion impact.
SEO teams may need page-query detail, device segments, CTR gaps, content decay, and technical annotations.
Google identifies BigQuery as the most effective route for joining Search Console bulk exports with Google Analytics BigQuery exports at scale. Looker Studio blending can support lighter use cases.
Connect GSC Performance to Engagement, Conversions, and Revenue
Search visibility has value only when it supports a real objective.
That objective may be revenue, leads, subscriptions, downloads, appointments, applications, readership, awareness, or customer support.
Search Console does not measure the full outcome. It tells you how the user reached the site from Google.
Connect that data with analytics, CRM, ecommerce, call tracking, or other first-party systems.
Join Landing-Page Visibility With Engagement and Conversion Data
The landing page is usually the safest common dimension between Search Console and analytics.
For each important page, compare:
GSC clicks and impressions, GA4 organic sessions, engagement, key events, lead quality, transactions, revenue, and assisted outcomes.
Do not force query-level revenue attribution when the data does not support it. Search Console hides some queries, and GA4 does not receive a complete organic query string for each session.
Page-level analysis still answers valuable questions.
Which high-traffic pages fail to move visitors forward? Which low-traffic pages generate strong leads? Which content attracts users early in the journey and later assists conversion? Which pages receive impressions but lack a clear next step?
A page with strong visibility and weak business performance may need better intent alignment, internal pathways, calls to action, product relevance, or user experience.
A page with strong conversion performance and limited visibility may deserve priority SEO investment.
Build an SEO Opportunity Score
An opportunity score helps teams compare unlike tasks.
A practical model can combine:
Search potential, ranking proximity, CTR gap, intent value, conversion performance, page relevance, implementation effort, and confidence.
Use normalized values rather than pretending the score is mathematically exact.
For example, rate each factor from one to five. Give more weight to business value and confidence. Reduce the score when implementation requires major development or when the diagnosis is uncertain.
A high score might describe a commercial page that ranks seventh for several relevant, high-impression terms, converts well, and needs clearer internal links and a stronger comparison section.
A low score might describe an unrelated query with many impressions, weak intent, position forty-eight, and no suitable landing page.
The purpose of the score is consistency.
It should help the team explain why one opportunity enters the roadmap while another waits.
Report Outcomes, Not Just Metric Movement
Stakeholders rarely need a list of every query that moved.
They need to know what changed, why it matters, what the team will do, and what outcome is expected.
Replace “Impressions increased 20 percent” with a clearer explanation:
“Non-branded impressions increased 20 percent across three product categories after new buying guides began ranking. Click growth remained at 8 percent because most new impressions are between positions eight and fifteen. The next step is to strengthen links from high-authority guides to category pages and improve commercial sections on the ranking articles.”
That statement connects data, cause, value, and action.
Report uncertainty honestly.
Say “the evidence suggests” when several causes remain possible. Define what you will monitor to confirm the diagnosis.
Trust grows when SEO reporting separates facts from assumptions.
Establish a Weekly, Monthly, and Quarterly GSC Analysis Routine
Performance analysis works best as a routine rather than an emergency response.
Different cadences serve different decisions.
Weekly reviews detect anomalies. Monthly reviews identify optimization opportunities. Quarterly reviews evaluate strategy, seasonality, markets, and business impact.
Weekly Checks for Anomalies, New Pages, and Sudden Changes
A weekly review should be focused.
Compare the latest complete week with the previous week and, where relevant, the same week last year.
Look for unusual changes in clicks and impressions. Check major directories, priority markets, devices, and search types.
Review newly published or updated pages. Early impressions can confirm that Google has begun testing them, but avoid judging final success too quickly.
Check major technical events and annotations.
Escalate sudden, unexplained, and commercially significant changes. Ignore ordinary movement that falls within the site’s normal range.
Weekly reporting should produce alerts and investigations, not a full rewrite of the SEO strategy.
Monthly Analysis for Opportunities and Content Decisions
Monthly analysis should go deeper.
Review winning and declining pages. Compare branded and non-branded performance. Identify high-impression low-CTR queries, striking-distance terms, expanding query groups, and possible cannibalization.
Evaluate previous actions.
Did the title update improve CTR? Did the content refresh expand relevant query coverage? Did the internal-link project strengthen target pages? Did a migration recover as expected?
Add qualified tasks to the roadmap with owners and expected outcomes.
Avoid creating a task for every metric fluctuation. The monthly review should select the few actions most likely to create meaningful value.
Quarterly Analysis for Strategy, Seasonality, and Business Impact
Quarterly analysis should examine direction.
Is non-branded discovery growing? Which topic clusters contribute qualified traffic? Which markets are expanding? Which page templates repeatedly underperform? Is organic growth concentrated in one risky category? Are AI and other result formats changing click behavior?
Compare Search Console performance with revenue, leads, subscriptions, or other goals.
Review resource allocation.
A site may spend heavily on new content while existing high-value pages decay. Another may chase rankings in markets it cannot serve. A publisher may generate millions of impressions in topics that do not support readership or commercial goals.
Quarterly reviews should influence content strategy, technical priorities, international plans, and measurement design.
Common Google Search Console Analysis Mistakes to Avoid
Search Console is easy to access, which can make its numbers look easier to interpret than they are.
Most mistakes come from missing context.
Treating Site-Wide Averages as Actionable Findings
“Average position improved from 18 to 14” sounds positive.
It does not tell you which queries improved, which pages changed, whether impressions shifted, or whether high-value traffic benefited.
The result may come from losing low-ranking impressions rather than gaining strong rankings.
Use property-wide metrics as health indicators. Use segmented data for decisions.
Move from property to directory, page, query group, country, device, and intent. Find the specific segment responsible for the change.
An actionable finding names the affected asset and audience.
Using Fixed CTR Thresholds Without Context
Advice such as “optimize every query below 2 percent CTR” creates busywork.
CTR depends on position, brand, intent, search appearance, device, market, and result-page design.
A query at position seventeen does not have the same click opportunity as one at position two. An AI answer can reduce clicks for a definition query. A branded product query may earn unusually high CTR.
Create internal CTR benchmarks from comparable groups.
Then prioritize statistically meaningful gaps connected to valuable queries.
Recommending Changes Without Recording a Hypothesis or Baseline
A page is updated. Traffic rises two months later. The team claims success.
Perhaps demand increased. Perhaps an update benefited the entire category. Perhaps another page redirected links. Perhaps rankings rose before the content change.
Record the baseline before implementation.
Document the changed elements, target queries, expected metric movement, comparison dates, and possible outside influences.
Use chart annotations to preserve timing. Keep a change log for major pages.
After the measurement period, compare the result with the original hypothesis.
SEO testing will never have the control of a laboratory experiment, but disciplined documentation produces far better evidence than memory.
Google Search Console Performance Analysis Checklist
Use the following sequence for repeatable GSC performance analysis:
- Confirm the correct Domain or URL-prefix property.
- Define the business or SEO question before applying filters.
- Select a date range that accounts for seasonality and day distribution.
- Review clicks and impressions to identify the shape of change.
- Add CTR and position to understand click capture and ranking context.
- Separate branded and non-branded query performance.
- Identify winning, declining, and newly emerging pages.
- Segment findings by device, country, search type, and search appearance.
- Check page-to-query and query-to-page relationships.
- Validate major findings through live SERPs, technical reports, and demand data.
- Connect landing-page performance with engagement, conversions, and business value.
- Prioritize actions by impact, effort, relevance, and confidence.
This order moves from broad detection to specific diagnosis.
Do not skip validation. Search Console may reveal where performance changed, but the cause can sit outside the Performance report.
Frequently Asked Questions About the GSC Performance Report
How Far Back Does Google Search Console Performance Data Go?
The standard Performance report provides up to 16 months of historical data.
This is enough for many year-over-year comparisons, but it does not support permanent historical analysis. Google introduced the longer retention period to help users examine long-term and year-over-year trends.
Businesses that need several years of data should establish a recurring export process.
Small sites can save monthly spreadsheet exports. Larger properties can use the Search Console API or configure BigQuery bulk export.
Begin storing data before you need it. Search Console cannot recreate historical periods that were never exported and have already passed beyond the available window.
What Is a Good Average CTR in Google Search Console?
There is no single good CTR for every site or query.
A useful CTR benchmark should account for:
Position, branded versus non-branded intent, device, country, query type, search appearance, and the result-page layout.
Compare a query with similar queries from your own property.
For example, compare a non-branded commercial mobile query in positions five to seven with other non-branded commercial mobile queries in the same position band.
Then confirm that the difference is based on enough impressions.
Improving CTR is valuable when the page already matches the query and the live result fails to communicate that value. A low CTR caused by weak ranking or mismatched intent requires a different solution.
Why Are Google Search Console Queries Missing?
Some queries are omitted to protect user privacy. These anonymized queries may contribute to chart totals while their exact text remains hidden from tables.
The interface can also limit tables to 1,000 rows, so large properties may not see every visible query row in a standard report.
Applying query filters can further change totals because hidden query text cannot match the filter.
The API and BigQuery provide broader access to data, but they do not reveal queries removed for privacy.
Use the available query data as a strong sample of search behavior while recognizing that it is not a complete keyword log.
Turn Search Console Data Into Better SEO Decisions
The Performance report becomes valuable when you stop reading it as a scoreboard.
Clicks, impressions, CTR, and position describe different parts of the same search journey. Queries reveal demand. Pages reveal which assets Google selects. Device, country, appearance, and search type explain where that performance occurred.
Start with a clear question. Establish a fair baseline. Segment the data. Validate the likely cause. Connect the finding with a business outcome. Then choose the action most likely to improve that outcome.
That process may lead to a title change, content refresh, internal-link project, technical repair, market expansion, page consolidation, or no action at all.
Choosing not to act can be the right decision when a change reflects seasonality, normal volatility, query expansion, or lower market demand.
Effective Search Console analysis is not about finding a problem in every chart. It is about distinguishing the signals that deserve attention from the noise that does not.
Related reading: What to Present in Monthly SEO Reports: Guide and What Is Branded Search & How to Optimize for It.